Table of Contents
Advertisement
Advertisement
Table of Contents

Related Manuals for HP 54753A


Summary of Contents for HP 54753A
- Page 1 User’s Guide Publication number 54753-97010 Second edition, January 1999 For Safety information, Warranties, and Regulatory information, see pages behind the index © Copyright Hewlett-Packard Company 1999 All Rights Reserved HP 54753A and HP 54754A TDR Plug-in Modules...
- Page 2 HP 54753A and HP 54754A Plug-in Modules The HP 54753A and 54754A TDR plug-in modules provide you with TDR and TDT measurement features. In addition to the TDR and TDT measurement features, the TDR plug-ins provide two accurate oscilloscope measurement channels with user selectable bandwidths of 12.4 or 18 GHz.
- Page 3 Option 001 HP 83480A mainframe operating system upgrade Option 002 HP 54750A mainframe operating system upgrade Option 003 Delete demo board HP 54755A TDR option for HP 83480A mainframe operating system upgrade Optional Accessories HP 10086A ECL terminator HP 54006A 6 GHz divider probe...
- Page 4 In This Book This book is the operating manual for the HP 54753A and HP 54754A TDR plug- in modules, and contains 13 chapters. General Information Chapter 1 contains overview information, menu and front panel key information, trigger information, and calibration information.
-
Page 5: Table Of Contents
Contents The Instrument at a Glance Menu and Key Conventions 1-3 The HP 54753A, 54754A TDR Plug-In Modules 1-4 Plug-in Module Purpose 1-4 Front Panel of the Plug-in Module 1-4 Getting the Best Performance 1-5 Installing a Plug-in Module 1-6... - Page 6 TDR 1 dest 4-5 Normalize response . . . 4-5 TDR rate automatic . . . (250 kHz) 4-8 Preset TDR/TDT 4-8 HP 54754A TDR/TDT Setup Menu Displaying the TDR/TDT Setup Menu 5-7 Stimulus 5-7 TDT 1 dest 5-8 Normalize response . . . 5-8 TDR rate automatic .
- Page 7 Contents Marker Menu 6-9 Reference 6-9 Marker units . . . 6-9 Response Menu Items 6-10 Single-ended TDR Measurements Single-ended TDR Features 7-3 Establishing the Reference Plane and Normalizing 7-8 Measuring Transmission Line Impedance 7-19 Measuring Transmission Line Percent Reflection 7-25 Measuring Excess L/C 7-32 Measuring the Distance to a Discontinuity 7-37 Differential TDR Measurements...
- Page 8 Contents 12 Specifications and Characteristics Specifications 12-3 Vertical Specifications 12-4 Environmental Specifications 12-5 Power Requirements 12-6 Weight 12-6 Characteristics 12-6 Trigger Input Characteristics 12-6 Product Regulations 12-7 13 In Case of Difficulty If You Have Problems 13-3 If the Mainframe Does Not Operate 13-3 If the Plug-in Does Not Operate 13-4 Error Messages 13-5 Contents-4...
-
Page 9: The Instrument At A Glance
The Instrument at a Glance... - Page 10 The Operating the Instrument What you’ll find in this chapter This chapter describes: • the key conventions used in this manual • the front panel, rear panel and keys that do not display menus on the screen Understanding the information in this chapter will help you successfully operate the instrument.
-
Page 11: Menu And Key Conventions
The Instrument at a Glance Menu and Key Conventions Menu and Key Conventions The keys labeled Trigger, Disk, and Run are all examples of front-panel keys. Pressing some front-panel keys accesses menus of functions that are displayed along the right side of the display screen. These menus are called softkey menus. -
Page 12: The Hp 54753A, 54754A Tdr Plug-In Modules
The front-power Probe Power connector allows automatic channel scaling and probe calibration with HP 54700 series probes. The front-panel Aux Power connector provides only power to HP 54700 series probes for use as a trigger input. Probe calibration and scaling are not required for a trigger input. -
Page 13: Getting The Best Performance
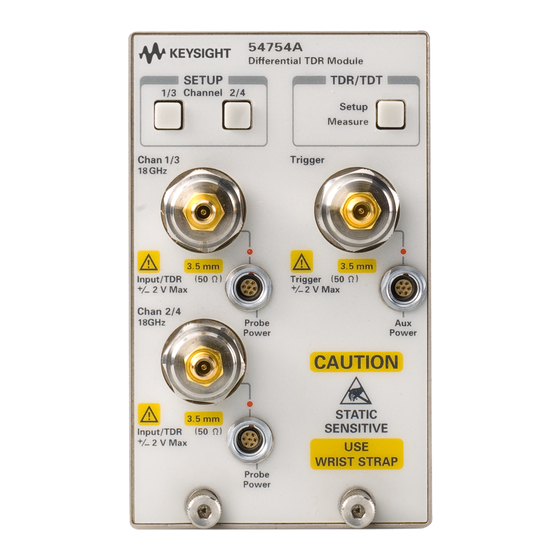
The Instrument at a Glance Getting the Best Performance Figure 1-1 Front panel of the plug-in module. Getting the Best Performance To ensure you obtain the specified accuracy, you must perform a plug-in module vertical calibration. The calibration must also be performed when you move a plug-in module from one slot to another or to a different mainframe. -
Page 14: Installing A Plug-In Module
You do not need to turn off the mainframe to install or remove a plug-in module. The plug-in module can be installed in slots 1 and 2 or 3 and 4 on the HP 83480A, 54750A mainframe. The plug-in module will not function if it is installed in slots 2 and 3. -
Page 15: Care And Handling Of Precision Connectors
Care and Handling of Precision Connectors... - Page 16 The Care and Handling of Precision Connectors What you’ll find in this chapter This chapter describes: • 3.5 mm connector care • connector wear • device specifications • accuracy considerations • visual inspection • mechanical inspection • connecting devices Understanding the information in this chapter will help you successfully operate the instrument.
-
Page 17: 3.5 Mm Connector Care
However, because the connectors often undergo many connections a day, they wear rapidly. Therefore, it is essential that all connectors on the HP 54753A or HP 54754A TDR plug-in modules be inspected regularly, both visually (with a magnifying glass) and mechanically (with a connector gage), and replaced as necessary. - Page 18 Note that this torque is less than that when mating precision 3.5 mm connectors with each other. A torque wrench suitable for SMA connectors preset to 5 lb.in. is available (HP part number 8710-1582, CD 0). The TDR plug-in modules come with adaptors already installed to prevent damage to the channel connectors.
- Page 19 Care and Handling of Precision Connectors Device Specifications the entire length of the center conductor. In addition, the diameter of both the center and outer conductors of an SMA connectors differ from that of a precision 3.5 mm connector. If these precautions and recommendations are followed, SMA connectors can be mated with 3.5 mm precision connectors without fear of expensive and time consuming repairs.
-
Page 20: Accuracy Considerations
Care and Handling of Precision Connectors Accuracy Considerations Figure 2-2 Typical SWR of SMA and Precision 3.5 mm Connectors Accuracy Considerations Accuracy requires that 3.5 mm precision connectors be used. However, SMA connectors can be used if special care is taken when mating the two, and all connectors are undamaged and clean. - Page 21 Care and Handling of Precision Connectors Accuracy Considerations Handling Precision 3.5 mm Connectors • Precision 3.5 mm connectors must be handled carefully if accurate calibrations and measurements are to be obtained. • Store the devices in the foam-lined storage case when not in use. •...
-
Page 22: Visual Inspection
Care and Handling of Precision Connectors Visual Inspection Visual Inspection Always begin a calibration with a careful visual inspection of the connectors, including the test set connectors to make sure they are and undamaged. C A U T I O N Make sure that you and your equipment are grounded before touching any center conductor so you won't cause static electricity and create a potential for electrostatic discharge. - Page 23 Care and Handling of Precision Connectors Mechanical Inspection Center Conductor The critical dimension to be measured is the recession of the center conductor. This dimension is shown as MP and FP in Figure 2-3 and Figure 2-4. No protrusion of the center conductor's shoulder is allowable on any connector. The maximum allowable recession of the center conductor shoulder is 0.003 in.
- Page 24 Care and Handling of Precision Connectors Mechanical Inspection Figure 2-3 D = inside diameter of the outer conductor d = diameter of male/female center connector A = outside diameter of outer conductor at the mating plane r = corner relief for male connector B = protrusion of the male contact pin tip beyond the outer conductor mating plane C = recession of the outer conductor mating plane behind outer face of connector MP = recession of male contact pin shoulder behind outer conductor mating plane...
- Page 25 Packard, one for each connector type, male and female. Refer to Figure 2-5. The part number for one gauge is HP 11752D. This gauge has a 3.5 mm connector (male and female). Or, you can use the 85052-60043 gauge with 3.5 mm female connector with an 85052-60042 3.5 mm male gauge.
- Page 26 Care and Handling of Precision Connectors Mechanical Inspection range will be on the plus (+) scale of the gauge. Also note that the allowable tolerance range for the test set connectors is different from the range for other connectors. Both ranges are shown in Figure 2-7 and Figure 2-8. Before measuring test set connectors, be sure that the power to the test set is off and that you and your equipment are grounded to prevent electrostatic discharge.
- Page 27 Care and Handling of Precision Connectors Mechanical Inspection Figure 2-6 Zeroing Precision 3.5 mm Connector Gauge 2-13...
- Page 28 Care and Handling of Precision Connectors Mechanical Inspection Figure 2-7 Measuring Precision 3.5 mm Male Connectors 2-14...
- Page 29 Care and Handling of Precision Connectors Mechanical Inspection Figure 2-8 Measuring Precision 3.5 mm Female Connectors 2-15...
-
Page 30: Connecting The Devices
This eliminates the very small air wedge between the outer conductors that frequently occurs when the body is held stationary during tightening, as it is in the traditional procedure. The HP 54753A or HP 54754A plug-in modules will detect the reflections caused by such small wedges. - Page 31 Care and Handling of Precision Connectors Connecting the Devices Counter-Rotation Technique The recommended Hewlett-Packard counter-rotation technique is for precision 3.5 mm connectors. Before making any connections to the channel connectors, ground yourself with a grounded wrist strap. Also, it is good practice to grasp the outer shell of the test port before you make any connections to the channel connectors in order to discharge any static electricity on your body.
- Page 32 Care and Handling of Precision Connectors Connecting the Devices When you are satisfied with this preliminary connection, use the following counter-rotation technique to eliminate air wedges between the mating planes. Refer to Figure 2-10. If the calibration device is male, hold the connector nut firmly.
- Page 33 Care and Handling of Precision Connectors Connecting the Devices To disconnect, follow this procedure: Loosen the connector nut on the male connector with the torque wrench. Leave the connection finger tight. While supporting the calibration device, gently unfasten the connectors and pull the calibration device straight out of the channel connector.
- Page 34 2-20...
-
Page 35: Setup Channel Menu
Setup Channel Menu... - Page 36 Channel key is pressed. There are several types of softkeys available. A description of the different softkeys and their functions is provided in the HP 83480A, 54750A User’s Quick Start Guide supplied with the mainframe.
- Page 37 Setup Channel Menu Figure 3-1 Electrical Setup Channel menu.
-
Page 38: Displaying The Setup Channel Menu
Setup Channel Menu Displaying the Setup Channel menu Displaying the Setup Channel menu To display the Setup Channel menu, press the Channel key. Display The Display softkey turns the channel display off and on. When the channel display is on, a waveform is displayed for that channel, unless the offset is adjusted so the waveform is clipped off of the display or the instrument is not triggering. -
Page 39: Offset
500 mV. You can use the knob, arrow keys, or keypad to change the offset setting. The fine mode also works with offset. When an HP 54700-series active probe is used with the plug-in module and is connected to the probe power connector adjacent to the channel input, the offset control adjusts the external scale factor and offset of the hybrid inside the active probe. -
Page 40: Bandwidth
Bandwidth. . . Bandwidth. . . You can use the Bandwidth function to select either 12.4 GHz or 18 GHz bandwidth. For the HP 54753A TDR plug-in module, channel 2 can be either 12.4 GHz or 20 GHz bandwidth. Key Path Channel Bandwidth. - Page 41 TDT destination. The two additional choices, ohms and % reflect are selectable once a TDR/TDT normalization and reference plane have been established (see the 54753A Setup Menu or 54754A Setup Menu chapter under Establish normalization & ref plane for more information).
-
Page 42: Calibrate
Setup Channel Menu Calibrate . . . Channel External scale . . . Units Volt Ext gain or Ext Offset Key Path Channel External scale . . . Units Watt Ext gain or Ext Offset Channel External scale . . . Units Unknown Ext gain or Ext Offset Calibrate . - Page 43 Setup Channel Menu Calibrate . . . TDR Skew The TDR Skew function changes the position of the TDR step. The TDR Skew function has a range of ≅ ±400 pS. The units of the function are shown in % of the maximum range, or ±100%.
- Page 44 Setup Channel Menu Calibrate . . . Cal status The Cal Status function displays a screen similar to Figure 3-8. Key Path Channel Calibrate Cal Status Figure 3-8 A typical Cal Status display. Current Date This is the current date and time. You can compare this to the last plug-in module calibration time.
- Page 45 Setup Channel Menu Calibrate . . . Channel 1 Calibration Status The instrument displays Calibrated when the plug-in module has been calibrated in the current mainframe slot otherwise the instrument displays Uncalibrated. Once a plug-in is calibrated, the temperature difference (∆Temp) between when the plug-in was calibrate and the current temperature is displayed.
-
Page 46: Calibration Overview
HP 83480A, 54750A Service Guide or the TDR performance verification using the HP 54753A/54A Service Guide. The second section addresses calibrations that are routinely performed by the end user. -
Page 47: Factory Mainframe Calibration
To maintain specifications, periodic recalibrations are necessary. We recommend that the plug-in module be calibrated at an HP service facility every 12 months. Users are encouraged to adjust the calibration cycle based on their particular operating environment or measurement accuracy needs. - Page 48 To prevent access to the mainframe calibration switch, place a sticker over the access hole to this switch. C A U T I O N Do not attempt a Mainframe calibration without consulting the HP 83480A, 54750A Service Guide. A mainframe calibration should be performed on a periodic basis (at least annually), or when the ambient operating has changed by and remains 5°C...
- Page 49 Setup Channel Menu Factory Mainframe Calibration Current Frame ∆Temp condition If the Current Frame ∆Temp listing is greater than ±5°C, then the mainframe should either be calibrated at the current operating temperature or be placed in an ambient air temperature that is within 5°C of the temperature of the current calibration.
-
Page 50: User Calibrations
Setup Channel Menu User Calibrations User Calibrations The following calibrations can be performed by the user: • Plug-in Module Vertical Calibration • Probe Calibration • Channel Skew • External Scale C A U T I O N The input circuits can be damaged by electrostatic discharge (ESD). Avoid applying static discharges to the front panel input connectors. - Page 51 Setup Channel Menu User Calibrations Miscellaneous User Calibration Summary Measurements Recommended Calibration What is calibrated Key Path Affected Interval Probe calibration Probe Attenuation Any measurement Whenever a probe is Channel Setup taken with the probe connected Calibrate Calibrate probe Channel Skew Calibrates out the small Multiple channel Before multiple...
- Page 52 Reference signals are both generated and routed internally. Probe Calibration For active probes such as the HP 54701A, which the instrument can identify through the probe power connector, the instrument automatically adjusts the channel vertical scale factors to the probe’s nominal attenuation, even if a probe calibration is not performed.
- Page 53 3 You can use the probe calibration to calibrate any network, including probes or cable assemblies. The instrument calibrates the voltage at the tip of the probe or the cable input. To calibrate an HP identifiable probe 1 Press the plug-in module’s front-panel-channel SETUP key. 2 Press Calibrate and then Calibrate Probe .
- Page 54 Setup Channel Menu User Calibrations External Scale The channels have a setting which allows the user to enter in an offset value to compensate for gains or losses not associated with the device under test. This feature is useful for adjusting out the effects of devices such as test fixtures and attenuators so that the reading on the display gives the measurement value associated with only the actual device under test.
-
Page 55: Hp 54753A Tdr/Tdt Setup Menu
HP 54753A TDR/TDT Setup Menu... - Page 56 HP 54753A TDR/TDT Setup Menu What you’ll find in this chapter This chapter describes the TDR/TDT Setup menu. A key tree and description of the available functions is included. C A U T I O N The input circuits can be damaged by electrostatic discharge (ESD).
- Page 57 HP 54753A TDR/TDT Setup Menu Figure 4-1 TDR/TDT Setup Stimulus External Cancel Enter TDR/TDT help . . . Single ended TDR/TDT Differential common mode TDR/TDT Done TDT 1 dest channel 2 none Cancel Enter Normalize response . . . Risetime...
-
Page 58: Displaying The Tdr/Tdt Setup Menu
Pressing the Stimulus softkey produces a pull-down menu used to turn on or turn off the TDR step. The HP 54753A is a single-ended TDR plug-in and has one TDR stimulus channel. The following table contains a list of the available stimulus menu choices and their descriptions. -
Page 59: Tdr 1 Dest
HP 54753A TDR/TDT Setup Menu TDR 1 dest If no other valid TDT destination channels are available, then "none" is the only choice. If a TDT destination other than none is selected, then the Preset TDR/TDT control will turn on and preset the TDT destination channel. - Page 60 HP 54753A TDR/TDT Setup Menu Normalize response . . . While the TDR step’s risetime applied to the system under test is fixed, the measured response has a set of mathematical operations applied to it. These mathematical operations effectively change the displayed response to the system just as if a different TDR step risetime had actually been applied.
- Page 61 However, the values used for normalization and reference plane calculations can be stored to and re- loaded from disk. (See the Disk Menu chapter in the HP 83480A, HP 54750 User’s Guide for more information.) The normalization filter values and reference plane become invalidated when the timebase scale, record length or channel bandwidth is changed.
-
Page 62: Tdr Rate Automatic
HP 54753A TDR/TDT Setup Menu TDR rate automatic . . . (250 kHz) Table 4-2 Establish normalization & ref plane Hardware Requirements Measurement Requirements 50 ohm 3.5 mm SMA terminator 3.5 mm SMA short 1 or 2 each 3.5 mm SMA cables 3.5 mm barrel connector... - Page 63 HP 54753A TDR/TDT Setup Menu Preset TDR/TDT Table 4-3 Preset TDR/TDT Configuration Menu Menu Item Set To Acquisition Averaging Best Flatness Time Base Scale 500.0 ps/div Position Set to a value which places the incident edge on screen. Channel 1 Setup...
- Page 64 4-10...
-
Page 65: Hp 54754A Tdr/Tdt Setup Menu
HP 54754A TDR/TDT Setup Menu... - Page 66 HP 54754A TDR/TDT Setup Menu What you’ll find in this chapter This chapter describes the HP 54754A TDR/TDT Setup menu. A key tree and description of the available functions is included. C A U T I O N The input circuits can be damaged by electrostatic discharge (ESD).
- Page 67 HP 54754A TDR/TDT Setup Menu Figure 5-1 TDR/TDT Setup Stimulus 1 only 2 only 1 and 2 differential common mode external Cancel Enter TDR/TDT help . . . Single ended TDR/TDT Differential common mode TDR/TDT Done TDT 1 dest channel 2...
- Page 68 HP 54754A TDR/TDT Setup Menu Risetime Normalize response . . . TDR/TDT TDR normalize Establish normalization & ref plane Done Normalize 1 response . . . Risetime TDR/TDT TDR normalize Establish normalization & ref plane Done Normalize 2 response . . .
- Page 69 HP 54754A TDR/TDT Setup Menu TDR response 1 . . . Response differential common mode Cancel Enter Response scaling . . . Vertical track source manual Y Scale Y Offset Horizontal track source manual X Scale X Position Done TDR response 2 . . .
- Page 70 HP 54754A TDR/TDT Setup Menu TDR rate automatic . . . (250 kHz) automatic manual TDR rate Done Preset TDR/TDT TDR/TDT Setup Menu.
-
Page 71: Displaying The Tdr/Tdt Setup Menu
HP 54754A TDR/TDT Setup Menu Displaying the TDR/TDT Setup Menu Displaying the TDR/TDT Setup Menu To display the TDR/TDT Setup menu, press the TDR/TDT Setup key on the TDR plug-in module. Stimulus Pressing the Stimulus softkey produces a pull-down menu used to turn on or turn off the TDR step. -
Page 72: Tdt 1 Dest
HP 54754A TDR/TDT Setup Menu TDT 1 dest 1 Only Stimulus Menus This section describes the menus that are available when the stimulus is set to 1 only. TDT 1 dest Pressing the TDT 1 dest softkey produces a pull-down menu used to select the channel used as the destination channel for TDT measurements. - Page 73 HP 54754A TDR/TDT Setup Menu Normalize response . . . which ever is greater, to a maximum of × 5 time per division (s/div) While the TDR step’s risetime applied to the system under test is fixed, the measured response has a set of mathematical operations applied to it. These mathematical operations effectively change the displayed response to the system just as if a different TDR step risetime had actually been applied.
- Page 74 However, the values used for normalization and reference plane calculations can be stored to and re- loaded from disk. (See the Disk Menu chapter in the HP 83480A, HP 54750 User’s Guide for more information.) The normalization filter values and reference plane are invalidated when the timebase scale, record length or channel bandwidth is changed.
-
Page 75: Tdr Rate Automatic
HP 54754A TDR/TDT Setup Menu TDR rate automatic . . . (250 kHz) Table 5-2 Establish normalization & ref plane Hardware Requirements Measurement Requirements 50 ohm 3.5 mm SMA terminator 3.5 mm SMA short 1 or 2 each 3.5 mm SMA cables 3.5 mm barrel connector... -
Page 76: Preset Tdr/Tdt
HP 54754A TDR/TDT Setup Menu Preset TDR/TDT Preset TDR/TDT The Preset TDR/TDT function prepares the oscilloscope for making TDR/TDT measurements by automatically setting several menu fields. The TDR preset feature appears in the TDR/TDT Setup menu once a stimulus has been selected. -
Page 77: Tdt 2 Dest
2 Only Stimulus Menus This section describes the menus that are available when the stimulus is set to 2 only. TDT 2 dest Pressing the TDT 2 dest softkey produces a pull-down menu used to select the channel used as the destination channel for TDT measurements. The choices available for this pull-down menu depend on the other TDR or electrical plug- in, if any, in the mainframe. - Page 78 HP 54754A TDR/TDT Setup Menu Normalize response . . . system just as if a different TDR step risetime had actually been applied. This allows you to select a risetime for TDR/TDT measurements that is close to the actual risetime used in your system. This risetime value applies to both TDR and TDT normalized channels.
- Page 79 However, the values used for normalization and reference plane calculations can be stored to and re- loaded from disk. (See the Disk Menu chapter in the HP 83480A, HP 54750 User’s Guide for more information.) The normalization filter values and reference plane are invalidate when the timebase scale, record length or channel bandwidth is changed.
-
Page 80: Tdr Rate Automatic
HP 54754A TDR/TDT Setup Menu TDR rate automatic . . . (250 kHz) The function steps you through the normalization and reference plane procedure for the selected measurement type. The procedure steps are displayed at the top of the screen. The items required for calibration are shown in Table 5-4. -
Page 81: Preset Tdr/Tdt
HP 54754A TDR/TDT Setup Menu Preset TDR/TDT Preset TDR/TDT The Preset TDR/TDT function prepares the oscilloscope for making TDR/TDT measurements by automatically setting several menu fields. The TDR preset feature appears in the TDR/TDT Setup menu once a stimulus has been selected. -
Page 82: Tdt 1 Dest
1 and 2 Stimulus Menus This section describes the menus that are available when the stimulus is set to 1 and 2. TDT 1 dest Pressing the TDT 1 dest softkey produces a pull-down menu used to select the channel used as the destination channel for channel 1 TDT measurements. The choices available for this pull-down menu depend on the other TDR or electrical plug-in, if any, in the mainframe. -
Page 83: Normalize 1 Response
HP 54754A TDR/TDT Setup Menu Normalize 1 response . . . Normalize 2 response . . . Normalize 1 response . . . Normalize 2 response . . . When the Stimulus is 1 and 2, there are two menus, Normalize 1 response and Normalize 2 response , which are used to normalize the two independent TDR channels separately. - Page 84 HP 54754A TDR/TDT Setup Menu Normalize 1 response . . . Normalize 2 response . . . TDR or TDT normalize The TDR normalize function is available if the TDR mode is selected by using the previous menu otherwise the TDT normalize function is available. In either case, this function turns on or off the display of the normalized trace.
-
Page 85: Tdr Rate Automatic
TDR rate automatic . . . (250 kHz) for normalization and reference plane calculations can be stored to and re- loaded from disk. (See the Disk Menu chapter in the HP 83480A, HP 54750 User’s Guide for more information.) The normalization filter values and reference plane are invalidate when the timebase scale, record length or channel bandwidth is changed. -
Page 86: Preset Tdr/Tdt
HP 54754A TDR/TDT Setup Menu Preset TDR/TDT rate varies automatically as the Time base Scale is changed to keep multiple steps off screen. As the TDR rate decreases, TDR measurements can be made on longer transmission lines. Key Path TDR/TDT Setup TDR rate automatic... -
Page 87: Tdr/Tdt
Differential and Common Mode Stimulus Menus This section describes the menus that are available when the stimulus is set to differential or common mode. TDR/TDT This TDR/TDT function allows you to select either TDR measurements or TDT measurements. The TDT measurement capability requires that an additional TDR or electrical plug-in module be installed in the mainframe. -
Page 88: Tdr Response 2
HP 54754A TDR/TDT Setup Menu TDR response 2 Horizontal There are two choices for horizontal mode: track source and manual . The track source mode sets the control of the horizontal scaling for the normalized trace to that of the source channel. When manual mode... -
Page 89: Tdt Response 1
HP 54754A TDR/TDT Setup Menu TDT response 1 TDT response 1 The TDT response 1 function is used to enable or disable the display of the differential or common mode response 1. The choices available are off, differential, or common mode. -
Page 90: Establish Ref Plane
HP 54754A TDR/TDT Setup Menu Establish ref plane Response scaling . . . The Response scaling function is used when vertical and horizontal scaling of the normalized response is required that is independent from that of the source channel. This function only appears when TDT response 2 is set to differential or common mode. -
Page 91: Tdr Rate Automatic
HP 54754A TDR/TDT Setup Menu TDR rate automatic . . . (250 kHz) Table 5-8 Establish ref plane Hardware Requirements Measurement Requirements 50 ohm 3.5 mm SMA terminator 3.5 mm SMA short 1 or 2 each 3.5 mm SMA cables 3.5 mm barrel connector... -
Page 92: Preset Tdr/Tdt
HP 54754A TDR/TDT Setup Menu Preset TDR/TDT Preset TDR/TDT The Preset TDR/TDT function prepares the oscilloscope for making TDR/TDT measurements by automatically setting several menu fields. The TDR preset feature appears in the TDR/TDT Setup menu once a stimulus has been selected. - Page 93 HP 54754A TDR/TDT Setup Menu Preset TDR/TDT Table 5-10 Common Mode Stimulus Preset TDR/TDT Configuration Menu Menu Item Set To Acquisition Averaging Best Flatness Time Base Scale 500.0 ps/div Position Set to a value which places the incident edge on screen.
-
Page 94: Tdt 1 Dest
External Stimulus Menus This section describes the menus that are available when the stimulus is set to external. TDT 1 dest Pressing the TDT 1 dest softkey produces a pull-down menu used to select the channel used as the destination channel for TDT measurements. The choices available for this pull-down menu depend on the other TDR or electrical plug- in, if any, in the mainframe. -
Page 95: Normalize Response
HP 54754A TDR/TDT Setup Menu Normalize response . . . Normalize response . . . The Normalize response function allows you to change the risetime of the normalized step, to select TDR and TDT normalization, to turn on or off the... - Page 96 HP 54754A TDR/TDT Setup Menu Normalize response . . . TDR or TDT normalize The TDR normalize function is available if the TDR mode is selected by using the previous menu otherwise the TDT normalize function is available. In either case, this function turns on or off the display of the normalized trace.
- Page 97 Normalize response . . . for normalization and reference plane calculations can be stored to and re- loaded from disk. (See the Disk Menu chapter in the HP 83480A, HP 54750 User’s Guide for more information.) The normalization filter values and reference plane are invalidate when the timebase scale, record length or channel bandwidth is changed.
-
Page 98: Tdr Rate Automatic
HP 54754A TDR/TDT Setup Menu TDR rate automatic . . . (250 kHz) TDR rate automatic . . . (250 kHz) The TDR rate automatic . . . (250 kHz) function allows you to manually or automatically select the repetition rate of the TDR step. The range of values for manual mode selection are from 50 Hz to 250 kHz repetition rate using a 1-2-5 sequence. -
Page 99: Measure And Other Tdr Specific Menus
Measure and Other TDR Specific Menus... - Page 100 Measure and Other TDR Specific Menus What you’ll find in this chapter This chapter describes the Measure menu and the mainframe menu changes that occur when a TDR plug-in module is in the mainframe. C A U T I O N The input circuits can be damaged by electrostatic discharge (ESD).
- Page 101 Measure and Other TDR Specific Menus Figure 6-1 Blue Key TDR/TDT Measure TDR minimum reflection channel # response # Cancel Enter TDR maximum reflection channel # response # Cancel Enter TDT propagation delay channel # response # Cancel Enter TDT gain channel # response # Cancel...
-
Page 102: Tdr/Tdt Measure Menu
Measure and Other TDR Specific Menus TDR/TDT Measure Menu TDR/TDT Measure Menu To display the Measure menu, press the blue key immediately followed by the TDR/TDT Measure key on the TDR plug-in module. There are four automated measurements which may be selected: TDR minimum reflection , TDR maximum reflection , TDT propagation delay , and TDT gain . - Page 103 Measure and Other TDR Specific Menus TDR/TDT Measure Menu For differential response to common mode stimulus and common mode response to differential stimulus, the following formula is used. – 1ref50Ω 2ref50Ω ----------------------------------------------------------------------- Minimum reflection ------------------------------------------------------------------------------------------------------------ - – – 1ref50Ω 1ref0Ω 2ref50Ω...
- Page 104 Measure and Other TDR Specific Menus TDR/TDT Measure Menu TDR Maximum Reflection Pressing the TDR maximum reflection softkey display the automatically calculated maximum percent reflection value at the bottom of the display under the waveform graticule. The TDR plug-in module must be calibrated and a reference plane established before this measurement can be selected.
- Page 105 Measure and Other TDR Specific Menus TDR/TDT Measure Menu For all other stimulus, the following formula is used. – ref 50Ω Maximum reflection ---------------------------------------- - – ref50Ω ref0Ω where: = the maximum voltage value along the waveform = the reference plane voltage into a 50 ohm load ref50Ω...
- Page 106 Measure and Other TDR Specific Menus TDR/TDT Measure Menu For differential response to differential stimulus and common mode response to common mode stimulus, the following formula is used: – TDT gain ------------------------------------------------------------------------------------------------------------ - – – 1ref50Ω 1ref0Ω 2ref50Ω 2ref0Ω where: = the maximum voltage value along the waveform = the minimum voltage value along the waveform = the channel 1 reference plane voltage into a 50 ohm load...
-
Page 107: Marker Menu
Measure and Other TDR Specific Menus Marker Menu Marker Menu To display the Marker menu, press the SETUP Marker key. There is a marker mode, the TDR/TDT marker mode, that is affected by the presence of a TDR plug- in module in the mainframe. Selecting the TDR/TDT mode produces the + Source , + Position , X Source , and X Position just like other plug-in modules. -
Page 108: Response Menu Items
Measure and Other TDR Specific Menus Response Menu Items Response Menu Items When a TDR plug-in module is present in the mainframe, response menu choices will appear in many of the mainframe menus. The following is a list of the mainframe menus which will contain response menu choices. •... -
Page 109: Single-Ended Tdr Measurements
Single-ended TDR Measurements... - Page 110 Single-ended TDR Measurements What you’ll find in this chapter This chapter describes how to make singe-ended TDR measurements and describes the reason for the processes required to make these measurements. C A U T I O N The input circuits can be damaged by electrostatic discharge (ESD). Therefore, avoid applying static discharges to the front-panel input connectors.
-
Page 111: Single-Ended Tdr Features
Single-ended TDR Measurements Single-ended TDR Features Single-ended TDR Features The HP 54753A and HP 54754A TDR plug-in modules are both capable of performing singe-ended TDR measurements. These measurements include characterizing microstrip lines, PC board traces, and coaxial cables. Because TDR measurements are complex, the TDR plug-in modules have several features which make measurements easier. - Page 112 Single-ended TDR Measurements Single-ended TDR Features in to the shorted end of the cable. Also, it allows the TDR response to be measured as though it had been stimulated by a step with no preshoot or overshoot rather than the actual step. The final stage in Establishing Normalization is measuring the response of the cable when a 50 ohm terminator is connected to the end of the cable in place of the short.
- Page 113 Single-ended TDR Measurements Single-ended TDR Features Bandwidth Limit This feature, which is located under waveform math, allows any waveform on screen to be filtered by a digital low pass filter. This filter is a 4th order Bessel- Thompson filter. It has no pre-shoot and very little overshoot. The inherent risetime of the TDR plug-in modules is 35 pS.
- Page 114 Single-ended TDR Measurements Single-ended TDR Features Excess L/C The most common discontinuities seen on an TDR waveform are due to series inductances or shunt capacitances. Some causes of series inductances are wire bonds or traces that are too narrow. Some causes of shunt capacitance are wire bond pads or traces that are too wide.
- Page 115 Single-ended TDR Measurements Single-ended TDR Features In cases where a discontinuity is due to a lumped L or C, the Excess L/C can be used to directly measure the L or C value. This is done by placing one marker just to the left of the discontinuity and the other marker just to the right of the disconinuity.
-
Page 116: Establishing The Reference Plane And Normalizing
Normalization requires the TDR step to be on screen and not clipped. To perform the tasks in this section, you need the following: • 1 good quality SMA cable one meter in length, such as the HP 8120-4948 cable. • 1 SMA short found on the HP 54754A plug-in module. - Page 117 Single-ended TDR Measurements Establishing the Reference Plane and Normalizing These steps set the oscilloscope to a known condition and activates the TDR step on channel 1. You should see a display similar to the one shown in Figure 7-2. Figure 7-2...
- Page 118 Single-ended TDR Measurements Establishing the Reference Plane and Normalizing Press the key located below the display. SETUP Time base Change the Scale until you see two positive going edges on screen (Figure 7-3). The left-most edge is the incident step and starts at 0 mV and goes to 200 mV. The right-most edge is the reflected step that has traveled from the TDR step generator to the end of the cable and back to the TDR sampler.
- Page 119 Single-ended TDR Measurements Establishing the Reference Plane and Normalizing Press the softkey. Enter You should see a display similar to the one in Figure 7-4. Note that the value of Risetime is 40 ps. Figure 7-4 7-11...
- Page 120 Single-ended TDR Measurements Establishing the Reference Plane and Normalizing Change the until the reflected edge is displayed at the Position approximate center of the display. You should see a display similar to the one shown in Figure 7-5, however, the risetime will depend on the quality of cable being used.
- Page 121 Single-ended TDR Measurements Establishing the Reference Plane and Normalizing Figure 7-6 The falltime of the reflected step is also greater than the risetime of the incident step. The next set of steps will establish normalization and the reference plane. Change the until the negative edge is at the third graticule from Position the left side of the display.
- Page 122 Single-ended TDR Measurements Establishing the Reference Plane and Normalizing Press the softkey. Enter Figure 7-7 The risetime of the normalized step is now approximately equal to the risetime of the incident step. Press the key followed by the key to turn on the automated blue measurement and select response 1.
-
Page 123: Press The Enter Softkey
Single-ended TDR Measurements Establishing the Reference Plane and Normalizing Performing TDT Normalization The purpose of this section is to show the process used to normalize a coaxial cable for TDT measurements. The following procedure shows how to perform TDT normalization. Connect a 1 m SMA coaxial cable from channel 1 to channel 2 of the TDR plug-in module. -
Page 124: Blue
Single-ended TDR Measurements Establishing the Reference Plane and Normalizing Change the until you see two positive going edges on screen Scale (Figure 7-8). Figure 7-8 Press the key followed by the key to turn on the automated blue risetime measurement. Select channel 1 to turn on the automated risetime measurement for channel 1. -
Page 125: Key Followed By The
Single-ended TDR Measurements Establishing the Reference Plane and Normalizing Figure 7-9 The risetime for channel 1 (incident step) is approximately 40 ps while the risetime for channel 2 (received step) is greater than 40 ps. This is due to cable and connector losses. - Page 126 Single-ended TDR Measurements Establishing the Reference Plane and Normalizing Set the to 39 ps. Risetime Figure 7-10 The risetime of the normalized TDT step is approximately the same as the risetime of the incident step. This shows that the effects due to cable and connector losses are removed.
-
Page 127: Measuring Transmission Line Impedance
This section shows how to measure transmission line impedance. To perform the tasks in this section, you need the following: • 1 good quality SMA cables one meter in length, such as the HP 8120-4948 cable. • 1 demo board (54754-66503) supplied with the TDR plug-in. - Page 128 STORAGE Setup Press the Default setup softkey. Press on the TDR plug-in module. TDR/TDT Setup Press the softkey and select for the HP 54753A). Stimulus 1 only Press the Enter softkey. Press the Preset TDR/TDT softkey. Press the key.
- Page 129 Single-ended TDR Measurements Measuring Transmission Line Impedance We will now measure the impedance of the narrow trace using the measured voltage along the discontinuity (vd1) of the transmission line and the following equation: × 50Ω ----------- - – where: vd1 200 mV –...
- Page 130 Before we can do this we must first establish normalization and the reference plane at the end of the cable connected to the demo board. This requires a very accurate low reflection 26.5 GHz 50 ohm load, such as the HP 909D. Press the key.
- Page 131 Single-ended TDR Measurements Measuring Transmission Line Impedance Connect an SMA short to the end of the cable. Press the Continue softkey. Remove the SMA short and connect an SMA 50 ohm load to the end of the cable. Press the softkey.
- Page 132 Single-ended TDR Measurements Measuring Transmission Line Impedance Change the until the + marker is over the peak of the narrow + Position trace discontinuity (Figure 7-14). Figure 7-14 The automated impedance measurement shows a value of 78.094 ohms which agrees approximately with our manually calculated value. However, the automated measurement is more accurate since it measured the actual step height instead of assuming a 200 mV step.
-
Page 133: Measuring Transmission Line Percent Reflection
500 ps. To perform the tasks in this section, you need the following: • 1 good quality SMA cable one meter in length, such as the HP 8120-4948 cable. • 1 each demo board (54754-66503) supplied with the TDR plug-in. - Page 134 Press the softkey. Default setup Press on the TDR plug-in module. TDR/TDT Setup Press the Stimulus softkey and select for the HP 54753A). 1 only Press the softkey. Enter Press the softkey. Preset TDR/TDT Press the Time base key.
- Page 135 Single-ended TDR Measurements Measuring Transmission Line Percent Reflection Figure 7-16 Wide Trace Discontinuity Since the generated TDR step has a risetime of 35 ps, it is impossible to directly measure the percent reflection to a 500 ps step. One way to measure the percent reflection of a 500 ps step is by using the waveform math bandwidth limit function.
- Page 136 Single-ended TDR Measurements Measuring Transmission Line Percent Reflection Press the softkey to turn off channel 1 display. Display Figure 7-17 The green waveform is function 2 which is the 500 ps filtered waveform of channel 1. Because 500 ps is much greater than 35 ps, the overall system risetime is approximately 500 ps.
- Page 137 Single-ended TDR Measurements Measuring Transmission Line Percent Reflection Press the softkey to select Vertical units Volt Press the Done softkey. Change the + Position until the + marker is over the negative peak of the wide trace discontinuity. Read the Y voltage value at the bottom of the display. Figure 7-18 Wide Trace Voltage...
- Page 138 Single-ended TDR Measurements Measuring Transmission Line Percent Reflection Press the softkey. Establish normalization & ref plane Connect an SMA short to the end of the cable. Press the Continue softkey. Remove the short from the end of the cable and connect an SMA 50 ohm load to the end of the cable.
- Page 139 Single-ended TDR Measurements Measuring Transmission Line Percent Reflection Figure 7-19 Wide Trace Percent Reflection The automated percent reflection at the + marker is seen at the bottom of the display. The measured value of -22.870 % agrees approximately with the previously calculated value of -22.40 %.
-
Page 140: Measuring Excess L/C
This section shows how to measure excess inductance and capacitance. To perform the tasks in this section, you need the following: • 1 good quality SMA cable one meter in length, such as the HP 8120-4948 cable. • 1 each demo board (54754-66503) supplied with the TDR plug-in. - Page 141 Single-ended TDR Measurements Measuring Excess L/C Figure 7-20 Press TDR/TDT Setup on the TDR plug-in module. Press the Normalize response . . . softkey. Press the softkey. Establish normalization & ref plane Connect an SMA short to the end of the cable. Press the Continue softkey.
- Page 142 Single-ended TDR Measurements Measuring Excess L/C Connect the cable to single transmission line connector closest to the narrow trace (Figure 7-21). Figure 7-21 Press the Clear display key. Whenever an external connection is changed, Clear display should be pressed to reset averaging. Press the key.
- Page 143 Single-ended TDR Measurements Measuring Excess L/C Figure 7-22 + Marker X Marker Excess L/C At the bottom of the display is shown the excess L/C which is 7.111091 nH for the narrow trace discontinuity. We will now measure the wide trace discontinuity’s excess L/C.
- Page 144 Single-ended TDR Measurements Measuring Excess L/C Change the until + marker is on the right side of the negative + Position bump. Change the X Position until the X marker is on the left side of the negative bump. Figure 7-23 + Marker X Marker Excess L/C...
-
Page 145: Measuring The Distance To A Discontinuity
This section shows how to measure the distance to a capacitive or inductive discontinuity. To perform the tasks in this section, you need the following: • 1 good quality SMA cable one meter in length, such as the HP 8120-4948 cable. - Page 146 Single-ended TDR Measurements Measuring the Distance to a Discontinuity Change the until the display is similar to Figure 7-20. Position Figure 7-24 Press on the TDR plug-in module. TDR/TDT Setup Press the softkey. Normalize response . . . Press the Establish normalization &...
- Page 147 Single-ended TDR Measurements Measuring the Distance to a Discontinuity Figure 7-25 Press the key. Whenever an external connection is changed, Clear display should be pressed to reset averaging. Clear display Press the SETUP Marker key. Press the Mode softkey and select TDR/TDT Press the softkey to select...
- Page 148 Single-ended TDR Measurements Measuring the Distance to a Discontinuity Change the until the + marker is on the left side of the positive + Position bump. Figure 7-26 + Marker Distance The distance from the reference plane to the narrow trace is shown at the bottom of the display (Figure 7-26).
-
Page 149: Differential Tdr Measurements
Differential TDR Measurements... - Page 150 Differential TDR Measurements What you’ll find in this chapter This chapter describes how to make differential TDR measurements and describes the reason for the processes required to make these measurements. C A U T I O N The input circuits can be damaged by electrostatic discharge (ESD). Therefore, avoid applying static discharges to the front-panel input connectors.
-
Page 151: Differential Tdr Features
Differential TDR Measurements Differential TDR Features Differential TDR Features The HP 54754A TDR plug-in module is capable of performing differential TDR measurements. These measurements include characterizing differential microstrip lines, differential PC board traces, and differential cables. Because differential TDR measurements are complex, the differential TDR plug-in module has several features which make measurements easier. - Page 152 Differential TDR Measurements Differential TDR Features channel Skew control moves the position of the acquired waveform. Both controls are needed to properly deskew the TDR step generators for differential TDR. Differential TDR measurements require two cables to be connected from the TDR channels to the device under test.
-
Page 153: Measuring Differential And Common Mode Impedance
To perform the tasks in this section, you need the following: • 2 good quality SMA cables one meter in length, such as the HP 8120-4948 cable. • 1 each demo board (54754-66503) supplied with the TDR plug-in. - Page 154 Differential TDR Measurements Measuring Differential and Common Mode Impedance Press the softkey and select Stimulus differential Press the Enter softkey. Press the Preset TDR/TDT softkey. Press the menu key below the display. SETUP Acquisition Change the # of averages from 16 to 4. These steps set the oscilloscope to a known condition and activate the TDR steps on channel 1 and channel 2.
- Page 155 Differential TDR Measurements Measuring Differential and Common Mode Impedance Press the softkey (Figure 8-2). Enter Figure 8-2 Press the SETUP Channe l key for the channel whose reflected step is the right-most step on the display. Press the Calibrate . . . softkey.
- Page 156 Differential TDR Measurements Measuring Differential and Common Mode Impedance Change the until the reflected edge is approximately centered Position in the display (Figure 8-3). Figure 8-3 Measured Skew A ∆time (skew) value of 7 ps (one fifth the TDR step risetime of 35 ps) or less is small enough that the skew will not introduce errors into TDR measurements.
- Page 157 Differential TDR Measurements Measuring Differential and Common Mode Impedance Figure 8-4 Establishing the Reference Plane Since we want to measure the impedance of a differential line, we must establish the reference plane so the scope can measure the height of the TDR step height. Press the key.
- Page 158 Differential TDR Measurements Measuring Differential and Common Mode Impedance Measuring Differential Impedance We are now ready to measure the differential impedance of the differential line. Connect the channel 1 cable to the differential line closest to the edge of the board. Connect the channel 2 cable to the other differential line (Figure 8-5).
- Page 159 Differential TDR Measurements Measuring Differential and Common Mode Impedance Figure 8-6 Reflected step at the end of differential line Start of differential line Waveform separation The portion of the waveforms starting at the left-hand of the display is where the cables are connected to the differential line. The positive and negative going steps are the reflected steps from the end of the differential line.
- Page 160 Differential TDR Measurements Measuring Differential and Common Mode Impedance Press the softkey. Alternate scale . . . Press the Units softkey and select Press the Enter softkey. Press the softkey(Figure 8-7). Done Figure 8-7 Both channel waveforms have positive going steps because ohms is always positive in a passive system.
- Page 161 Differential TDR Measurements Measuring Differential and Common Mode Impedance Figure 8-8 Switch connection Response 1 Waveform Differential Impedance Press the SETUP Marker key. Press the Mode softkey and select TDR/TDT Press the softkey. Enter Press the + Source softkey and select response 1 Press the Enter...
- Page 162 Differential TDR Measurements Measuring Differential and Common Mode Impedance Measuring Common Mode Impedance We are now ready to measure the common mode impedance of the differential line. This section assumes that the differential mode impedance section has been completed and that the oscilloscope settings have not been changed. Press the TDR/TDT Setup key.
-
Page 163: Making Differential Tdt Measurements
TDT measurements. To perform the tasks in this section, you need the following: • 4 good quality SMA cables one meter in length, such as the HP 8120-4948 cable. • 2 female-to-female SMA adapters. - Page 164 Differential TDR Measurements Making Differential TDT Measurements These steps set the oscilloscope to a known condition and activates the TDR steps on channel 1 and channel 2. You should see a display similar to Figure 8-10. Channel skew is set to 0.0 s for both channels. It is important to set these controls to 0.0 s before adjusting the TDR skew otherwise the TDR step generator skew will be incorrectly set.
- Page 165 Differential TDR Measurements Making Differential TDT Measurements Figure 8-11 Press the l key for the channel whose reflected step is the SETUP Channe right-most step on the display. Press the softkey. Calibrate . . . ∆ Change the TDR Skew until the remaining Time is approximately 0.
- Page 166 Differential TDR Measurements Making Differential TDT Measurements Change the until the reflected edge is approximately centered Position in the display (Figure 8-12). Figure 8-12 Measured Skew A ∆time (skew) value of 7 ps (one fifth the TDR step risetime of 35 ps) or less is small enough that the skew will not introduce errors into TDR measurements.
- Page 167 Differential TDR Measurements Making Differential TDT Measurements Figure 8-13 Establishing the Reference Plane Since we want to measure the impedance of a differential line, we must establish the reference plane so the scope can measure the height of TDR step height. Press the key.
- Page 168 Differential TDR Measurements Making Differential TDT Measurements Deskewing the TDT Channels In addition to the TDR step generators requiring deskewing the two TDT destination channels require deskewing. Use the following procedure to deskew the TDT destination channels. Connect an SMA cable to channel 3 of the electrical plug-in module. Connect another SMA cable to channel 4 of the electrical plug-in module.
- Page 169 Differential TDR Measurements Making Differential TDT Measurements Figure 8-14 Press the electrical plug-in module’s SETUP Channel key whose waveform is closest to the right side of the display. (For the example shown in Figure 8-14, channel 4 is chosen.) Press the Calibrate .
- Page 170 Differential TDR Measurements Making Differential TDT Measurements Connect the channel 4 cable to the other end of the differential line closest to the edge of the demo board(Figure 8-15). Figure 8-15 Press the key. SETUP Channel 1/3 Press the Display softkey to turn off the display of channel 1.
-
Page 171: Press The Enter Softkey (Figure 7-9)
Differential TDR Measurements Making Differential TDT Measurements Figure 8-16 Press the blue key followed by the key. Press the SETUP Channel 3 key of the electrical plug-in module. Press the softkey to turn off the channel 3 display. Display Press the SETUP Channel 4 key of the electrical plug-in module. - Page 172 Differential TDR Measurements Making Differential TDT Measurements Figure 8-17 Press the SETUP Channel 3 key of the electrical plug-in module. Press the Display softkey to turn on the channel 3 display. Press the key of the electrical plug-in module. SETUP Channel 4 Press the Display softkey to turn on the channel 4 display.
- Page 173 Differential TDR Measurements Making Differential TDT Measurements Figure 8-18 This situation might occur on a clock distribution line of a digital PC board where an input pin of a gate connected one side of line has an excess capacitance of 10 pF.
- Page 174 8-26...
-
Page 175: Tdr Fundamentals
TDR Fundamentals... - Page 176 Introduction The most common method for evaluating a transmission line and its load has traditionally involved applying a sine wave to a system and measuring waves resulting from discontinuities on the line. From these measurements, the standing wave ratio (SWR) is calculated and used as a figure of merit for the transmission system.
- Page 177 TDR Fundamentals a concise presentation of the fundamentals of TDR and then relates these fundamentals to the parameters that can be measured in actual test situations. Before discussing these principles further we will briefly review transmission line theory. Figure 9-1 Voltage vs Time at a Particular Point on a Mismatched Transmission Line Driven with a Step of Height E...
-
Page 178: Propagation On A Transmission Line
TDR Fundamentals Propagation on a Transmission Line Propagation on a Transmission Line The classical transmission line is assumed to consist of a continuous structure of resistors (R), inductors (L) and capacitors (C), as shown in Figure 9-2. By studying this equivalent circuit, several characteristics of the transmission line can be determined. - Page 179 TDR Fundamentals Propagation on a Transmission Line The velocity at which the voltage travels down the line can be defined in terms of β where: ω --- - unit length per second β The velocity of propagation approaches the speed of light, v , for transmission lines with air dielectric.
-
Page 180: Step Reflection Testing
TDR Fundamentals Step Reflection Testing by the phase relationship between incident and reflected waves. The ratio of the maximum and minimum values of this voltage is called the voltage standing wave ratio, σ, and is related to the reflection coefficient by the equation ρ... - Page 181 TDR Fundamentals Step Reflection Testing the characteristic impedance of the line no wave is reflected and all that will be seen on the oscilloscope is the incident voltage step recorded as the wave passes the point on the line monitored by the oscilloscope. Refer to Figure 9-4. Figure 9-4 Oscilloscope Display When E If a mismatch exists at the load, part of the incident wave is reflected.
- Page 182 TDR Fundamentals Step Reflection Testing The velocity of propagation can be determined from an experiment on a known length of the same type of cable for example, the time required for the incident wave to travel down and the reflected wave to travel back from an open circuit termination at the end of a 120 cm piece of RG-9A/U is 11.4 ns resulting in a v = 2.1 x 10 cm/sec.
- Page 183 TDR Fundamentals Step Reflection Testing Figure 9-6 TDR Displays for Typical Loads These displays are easily interpreted by recalling this equation: – ρ ---- - ----------------- - Knowledge of E and E , as measured on the oscilloscope, allows Z to be determined in terms of Z , or vice versa.
- Page 184 TDR Fundamentals Step Reflection Testing Assuming Z is real (approximately true for high quality commercial cable), it is seen that resistive mismatches reflect a voltage of the same shape as the driving voltage, with the magnitude and polarity of E determined by the relative values of Z and R...
- Page 185 TDR Fundamentals Step Reflection Testing Figure 9-7 τ τ WHERE τ τ WHERE Oscilloscope Displays for Complex Z 9-11...
- Page 186 TDR Fundamentals Step Reflection Testing A similar analysis is possible for the case of the parallel R-C termination. At time zero, the load appears as a short circuit since the capacitor will not accept a sudden change in voltage. Therefore ρ = - 1 when t = 0. After some time, however, voltage builds up on C and its impedance rises.
- Page 187 TDR Fundamentals Step Reflection Testing Figure 9-8 Determining the Time Constant of a Reflected Wave Returning from a Complex Z Discontinuities on the Line So far, mention has been made only about the effect of a mismatched load at the end of a transmission line. Often, however, one is not only concerned with what is happening at the load, but also at intermediate points along the line.
- Page 188 TDR Fundamentals Step Reflection Testing right of M is Z , an equivalent representation is shown in Figure 9-10. The pattern on the oscilloscope is merely a special case of Figure 9-7A and is shown on Figure 9-11. Figure 9-10 Equivalent System Figure 9-11 Multiple Discontinuities...
- Page 189 TDR Fundamentals Step Reflection Testing The oscilloscope's display for this situation would be similar to the diagram in Figure 9-13 (drawn for the case where Z > Z > Z’ Figure 9-13 It is seen that the two mismatches produce reflections that can be analyzed separately.
- Page 190 TDR Fundamentals Step Reflection Testing ′ and Z , such as ρ ′E The part of E reflected from the junction of Z , is again reflected off the load and heads back to the monitoring point only to be ′‚...
- Page 191 TDR Fundamentals Step Reflection Testing Figure 9-14 Ω Ω A 50 TDR System Testing a 50 Line Terminated With an Open Circuit. In Figure 9-15 this was not the case. Here the source impedance of the step generator is 50 Ω and the line impedance is 75 Ω. The jump from a 50 Ω to a 75 Ω...
- Page 192 TDR Fundamentals Step Reflection Testing Figure 9-15 Ω Ω A 50 TDR System Testing a 75 Line Terminated With an Open Circuit Yields a Display That is More Difficult to Interpret Balun For measurements of transmission lines in the 200 Ω to 300 Ω region, a balun is the best solution.
- Page 193 TDR Fundamentals Step Reflection Testing Shunt resistance, ----------- - < 50 Ω: for Z 50 50 Z – Resistance in series with source, Shunt resistance, ----------- - The incident step and the reflections will be attenuated considerably. Refer to Figure 9-17. The sacrifice made to achieve the reflectionless connection is sensitivity, and a loss of calibration.
-
Page 194: Instrument Configuration
The major drawback of this architecture is that small reflections from the terminated step generator are measured directly by the through-line sampler. In the HP 54750 Series TDR systems, the terminated sampler and through-line step generator architecture in Figure 9-19 is used. In this case step generation is accomplished using a switched current source driven from a step recovery diode. - Page 195 TDR Fundamentals Instrument Configuration Figure 9-19 The terminated sampler, terminated step generator, and power splitter architecture in Figure 9-20 is usable but is typically not used because both the incident and reflected step are attenuated when they pass through the power splitter.
- Page 196 -- - ε This means that with the HP 54750 Series TDR system risetime of 45 ps, two discontinuities merge together and become indistinguishable at 3.5 mm for an air dielectric. For practical systems the HP 54750 Series TDR systems define the distance resolution to be twice this number, or 7 mm in air.
- Page 197 TDR Fundamentals Instrument Configuration The results of a TDR measurement, using normalization to decrease the system risetime, on this airline at three different risetimes (40, 26, and 10 ps) is shown in Figure 9-21. At 40 ps it is not possible to distinguish each discontinuity. At 26 ps the separate discontinuities begin to show.
- Page 198 TDR Fundamentals Instrument Configuration Figure 9-22 System Risetime Affects the TDR Results In analyzing TDR results so far, we have assumed that the time constant and therefore risetime (t ) created by a discontinuity were known and therefore r lpf the value of the inductor L or capacitor C was also known.
- Page 199 TDR Fundamentals Instrument Configuration higher than the slope of a line through the 10% and 90% risetime points. For reflections less than 10%, the error resulting from this method is less than 3%, not including measurement error of the TDR system. For a series inductive discontinuity, the relationship between the reflected signal and the inductor, L, is found as follows: Since ωL <<...
- Page 200 TDR Fundamentals Instrument Configuration Since ρ ------ - then 98.4ρt r system For a series L discontinuity ±3% when ρ ≤ to 10% Using a similar derivation for a shunt C interline discontinuity, the relationship between shunt C and the reflection is: 0.0303ρt For a shunt C discontinuity ±3% when ρ...
- Page 201 TDR Fundamentals Instrument Configuration Figure 9-23 Short Cables (B) and Normalization (C) can Reduce the Effects of Cable Loss Seen in (A) Multiple Discontinuities Multiple discontinuities are another source of error in TDR measurements. A discontinuity that occurs before the discontinuity of interest will cause a degradation of risetime and accuracy of reflection measurements similar to cable losses.
- Page 202 TDR Fundamentals Instrument Configuration Using TDR to Test Interconnects One of the largest applications of TDR measurements is optimizing and testing transmission line systems. An example of this involves the interface from a PC board 50 Ω line to a thickfilm hybrid 50 Ω line. If the connection was made with a 3 mm wire bond, then this would introduce a series inductive discontinuity into the line.
- Page 203 TDR Fundamentals Instrument Configuration Therefore the risetime of the signal that is to pass through this discontinuity should be greater than 66 ps if it is not to be significantly degraded. If the signal to be transmitted through the discontinuity was a 350 ps risetime logic signal, then the risetime degradation would be small.
- Page 204 TDR Fundamentals Instrument Configuration where therefore ------- - 0.6 pF The resultant circuit is actually a third order Butterworth filter. Refer to Figure 9-27. The bandwidth of the resultant Butterworth filter has the same bandwidth as the initial single pole filter. Since the risetime of the step to be transmitted is much greater than the risetime of either the single pole or Butterworth filter there will be little effect on the transmitted step.
- Page 205 TDR Fundamentals Instrument Configuration Figure 9-25 Figure 9-26 Inductance of the Wirebond Causes a Reflection 9-31...
- Page 206 TDR Fundamentals Instrument Configuration Figure 9-27 Extra Capacitance can Compensate for the Wirebond's Inductance, Reducing the Reflection 9-32...
-
Page 207: Improving Time Domain Network Measurements
Improving Time Domain Network Measurements... - Page 208 Normalization, an error-correction process, helps ensure that time domain network analysis measurements are as accurate as possible. The HP 54750A Series digitizing oscilloscopes with TDR capability include normalization as a standard feature. With normalization software built into the oscilloscope, external controllers and variable edge speed step generators or risetime converters are not needed.
-
Page 209: Sources Of Measurement Error
Improving Time Domain Network Measurements Sources of Measurement Error Sources of Measurement Error There are three primary sources of error in TDNA measurements: the cables and connectors, the oscilloscope, and the step generator. Cables and Connectors Cause Losses and Reflections Cables and connectors between the step source, the DUT, and the oscilloscope can significantly affect measurement results. - Page 210 Improving Time Domain Network Measurements Sources of Measurement Error Figure 10-1 The top waveform shows distortions caused by cables and connectors. The bottom waveform shows how normalization corrects for these distortions The Oscilloscope as an Error Source Oscilloscopes introduce errors into measurements in several ways. The finite bandwidth of the oscilloscope translates to limited risetime.
- Page 211 Improving Time Domain Network Measurements Sources of Measurement Error The risetime of the step is also extremely important. In most cases the step generator used for TDNA will have a fixed risetime. A hardware filter known as a risetime convertor can be used in some systems to change the risetime. To determine how the DUT will actually respond in it’s intended application, you should test it at edge speeds similar to those it will actually encounter.
-
Page 212: Removing Measurement Errors
Improving Time Domain Network Measurements Removing Measurement Errors Edge speed is also critical when using TDR to locate the source of a discontinuity along a transmission line. Just as the limited risetime of the oscilloscope can limit the accuracy of this kind of measurement, the risetime of the step source can also limit accuracy. - Page 213 A digital error-correction method known as normalization can significantly reduce or remove all of the above types of errors from TDNA measurements. Taking full advantage of its powerful internal microprocessor, the HP 54750A Series digitizing oscilloscopes with TDR capability include normalization as a standard feature.
- Page 214 Improving Time Domain Network Measurements Removing Measurement Errors Figure 10-3 Test system with the device at the end of an imperfect test fixture This example uses two identical printed circuit boards (PCBs) to model this measurement. The PCBs have a 50 Ω trace on them with two discontinuities. The first PCB represents the test fixture, and the second PCB represents the DUT.
- Page 215 Improving Time Domain Network Measurements Removing Measurement Errors By defining a reference plane to be at the end of the test fixture (first PCB) and then normalizing, the errors can be corrected. Figure 10-5 Normalization uses a short, then a 50 Ω termination to define a reference plane and to generate a digital filter Figure 10-6 The normalized measurement corrects for the errors introduced by test fixture.
- Page 216 Improving Time Domain Network Measurements Removing Measurement Errors To further verify the accuracy of the normalization, the response of the second PCB is measured without the first PCB. Figure 10-7 The unnormalized response of the DUT, measured without the test fixture Example 2 Resolving two discontinuities separated by 2 mm.
- Page 217 Improving Time Domain Network Measurements Removing Measurement Errors Figure 10-8 Normalization improves the ability to distinguish two discontinuities by decreasing the system risetime. a. System risetime = 45 ps. b. System risetime = 100 ps. c. System risetime = 50 ps. d.
- Page 218 Improving Time Domain Network Measurements Removing Measurement Errors In both cases, the measured waveforms are stored and subtracted directly from the measured DUT response before the response is filtered. Ideally, these normalization waveforms are flat lines. Any non-flatness or ringing is superimposed on the measured DUT response and represents a potential measurement error source.
- Page 219 Improving Time Domain Network Measurements Removing Measurement Errors Generating the Digital Filter The second part of the normalization process generates the digital filter. Unlike the errors removed by subtracting the first normalization signal, the errors removed by the filter are proportional to the amplitude of the DUT response. For the second part of the TDR normalization process, the DUT is replaced by a short circuit.
- Page 220 Improving Time Domain Network Measurements Removing Measurement Errors BNC connector. A secondary reflection from the DUT is visible at the right end of the baseline. Notice that the secondary reflection is indeed quite small. It has a peak voltage value of about 1.5 mV at 40 ps risetime, which is about 0.75% of the 200 mV incident step.
- Page 221 Improving Time Domain Network Measurements Removing Measurement Errors Figure 10-11 By adding a section of airline between the test port and the DUT, you can more clearly distinguish primary and secondary reflections After an adequate separation has been achieved, a time window can be selected which does not include the undesirable secondary reflections.
- Page 222 Improving Time Domain Network Measurements Removing Measurement Errors from the measurement without losing any of the primary reflection data. In CW TDNA, time windowing is cumbersome, thus a third normalization measurement is used. Figure 10-12 Decreasing delay in the bottom waveform removes the secondary reflection shown at the right end of the baseline in the top waveform.
- Page 223 Improving Time Domain Network Measurements Removing Measurement Errors for ∑ 2πfk – W f ( ) < < ---------- - ----- - -- - where : L = the full width of the window in hertz f = frequency in hertz A window of this form may be selected that rolls off quickly and has an almost Gaussian impulse response.
- Page 224 Removing Measurement Errors Figure 10-13 Basic system frequency response In the HP 54750A Series digitizing oscilloscopes with TDR capability, the user- specified risetime determines the bandwidth of the filter. Decreasing the bandwidth is accomplished by attenuating the frequencies that are beyond the bandwidth of interest (Figure 10-14).
- Page 225 Improving Time Domain Network Measurements Removing Measurement Errors To increase the bandwidth, the response beyond the initial -3 dB frequency needs to be amplified. While this is a valid step, it is important to realize that the system noise at these frequencies and at nearby higher frequencies is also amplified (see Figure 10-15).
- Page 226 Improving Time Domain Network Measurements Removing Measurement Errors M f ( ) D f ( ) S f ( )N f ( ) M f ( )F f ( ) N f ( ) D f ( )S f ( )F f ( ) W f ( ) N f ( ) D f ( )W f ( )E f ( )
- Page 227 Improving Time Domain Network Measurements Removing Measurement Errors Putting It All Together The actual normalization of a DUT response is accomplished in two steps. A stored waveform, derived in the normalization and which represents the systematic errors, is subtracted from the measured DUT waveform. This result is then convolved with the digital filter to yield the response of the DUT, normalized to an ideal step input with the user-specified risetime.
- Page 228 10-22...
-
Page 229: Transmission Line Theory Applied To Digital Systems
Transmission Line Theory Applied to Digital Systems... -
Page 230: Transmission Line Design
Introduction Understanding the operation of transmission lines used in conjunction with high speed MECL circuits is necessary in order to be able to completely characterize system operation. This Chapter describes transmission lines with respect to both line reflections and propagation delay times. - Page 231 Transmission Line Theory Applied to Digital Systems Transmission Line Design Microstrip and strip lines may be treated as operating in the transverse electro- magnetic (TEM) mode. Although microstrip propagation is not purely TEM because of non-uniform dielectrics, for all practical purposes it can be treated as TEM.
- Page 232 Transmission Line Theory Applied to Digital Systems Transmission Line Design Figure 11-2 MECL Gate Driving a Transmission Line The circuit of Figure 11-2 can be redrawn as shown in Figure 11-3 to include the equivalent circuit of the MECL gate. The resistor, R , is the output source impedance (for MECL 10K/10KH it is 7 Ω, and MECL III it is 5 Ω).
- Page 233 Transmission Line Theory Applied to Digital Systems Transmission Line Design where: t ( ) t ( ) ----------------- - (t) = voltage at point A, x = the distance to an arbitrary point on the line, l = the total line length, = the propagation delay of the line in ns/unit distance, = l t...
- Page 234 Transmission Line Theory Applied to Digital Systems Transmission Line Design – ρ ----------------- - By summing the incident voltage v (equation 1), together with similar voltage contributions from the various orders of reflection (due to ρ and ρ ), a general equation for total line voltage can be written, and used to develop practical design information: v x t ,...
- Page 235 Transmission Line Theory Applied to Digital Systems Transmission Line Design Figure 11-4 Latice Diagram for a Typical Reflection Example The load resistor is arbitrarily chosen to be 30 percent greater (65 Ω) than the characteristic impedance (50 Ω) so that reflections will occur. The resulting reflection coefficient at the load is ρ...
- Page 236 Transmission Line Theory Applied to Digital Systems Transmission Line Design The voltage and current at points A and B are the same initially, as shown in Figure 11-4. At t = 0, the voltage at the source switches from a logic 0 to a logic 1 level.
- Page 237 Transmission Line Theory Applied to Digital Systems Transmission Line Design A slightly different situation can exist when the output of the MECL gate switches from a logic 1 to a logic 0. The output of the MECL gate will turn off if the termination resistor, R , is somewhat larger than the characteristic impedance of the line.
- Page 238 Transmission Line Theory Applied to Digital Systems Transmission Line Design Example 2 The condition for a negative-going transition will now be analyzed. Refer to Figure 11-5. The steady state high logic level current is: V′ ----------------- - 11.6 mA For the conditions shown in Figure 11-5, the use of equation 6 shows that the load resistor is indeed larger than required to turn off the output transistor during a negative transition.
- Page 239 Transmission Line Theory Applied to Digital Systems Transmission Line Design Figure 11-5 Lattice Diagram for Negative-Going Voltage Transition To determine the voltage V at t = 0, the following equation results from the application of Ohm's Law to the circuit: ...
- Page 240 Transmission Line Theory Applied to Digital Systems Transmission Line Design – ( Solving equation 8, V = 0.58 V. The implication of this result is that stubbing off the line with gate loads in a distributed fashion is not recommended, due to the reduced initial voltage swing.
- Page 241 Transmission Line Theory Applied to Digital Systems Transmission Line Design term, T , is the amount of time it takes for the waveform at A to switch to the level at which the output transistor turns off. The fall time of the signal would have been longer by an amount equal to: 1.16 0.305 –...
- Page 242 Transmission Line Theory Applied to Digital Systems Transmission Line Design Equation 10 may be illustrated by solving for the steady state reflection voltage at t = 2T ----- - ----- - ∞ ∞ ...
-
Page 243: Signal Propagation Delay For Microstrip And Strip Lines With Distributed Or Lumped Loads
Transmission Line Theory Applied to Digital Systems Signal Propagation Delay for Microstrip and Strip Lines with Distributed or Lumped Loads Signal Propagation Delay for Microstrip and Strip Lines with Distributed or Lumped Loads The propagation delay, t , has been shown to be 1.77 ns/ft for microstrip lines and 2.26 ns/ft for strip lines, when a glass epoxy dielectric is the surrounding medium. - Page 244 Transmission Line Theory Applied to Digital Systems Signal Propagation Delay for Microstrip and Strip Lines with Distributed or Lumped Loads For a 50 Ω strip line on a glass epoxy board with a 15 mil spacing between the strip line and ground plane, a 12 mil width would be required, and the strip line would exhibit a capacitance of 41 pF/ft.
- Page 245 Transmission Line Theory Applied to Digital Systems Signal Propagation Delay for Microstrip and Strip Lines with Distributed or Lumped Loads An equation for maximum open line length for a strip line (using G-10 fiber glass epoxy material) can be written in a similar fashion as follows: (13) ------ - l –...
- Page 246 Transmission Line Theory Applied to Digital Systems Signal Propagation Delay for Microstrip and Strip Lines with Distributed or Lumped Loads Table 11-1 Maximum Open Line Length for MECL 10,100 (Gate Rise Time = 3.5 ns) (OHMS) FANOUT = 1 FANOUT = 2 FANOUT = 4 FANOUT = 8 (2.9pF)
- Page 247 Transmission Line Theory Applied to Digital Systems Signal Propagation Delay for Microstrip and Strip Lines with Distributed or Lumped Loads Table 11-2 Maximum Open Line Length for MECL 10,200, MECL 10H100, 10H210, 10H211 (Gate Rise Time = 2 ns) (OHMS) FANOUT = 1 FANOUT = 2 FANOUT = 4...
- Page 248 Transmission Line Theory Applied to Digital Systems Signal Propagation Delay for Microstrip and Strip Lines with Distributed or Lumped Loads Table 11-3 Maximum Open Line Length for MECL III, MECL 10H209 (Gate Rise Time 1.1 ns) (OHMS) FANOUT = 1 FANOUT = 2 FANOUT = 4 FANOUT = 8...
-
Page 249: Microstrip Transmission Line Techniques Evaluated Using Tdr Measurements
Transmission Line Theory Applied to Digital Systems Microstrip Transmission Line Techniques Evaluated Using TDR Measurements From these calculations, it can be concluded that lower impedance lines result in longer line lengths before termination is required. The lower impedance lines are preferred over higher impedance lines because longer open lines are possible, and the propagation delay down the line is reduced. - Page 250 Transmission Line Theory Applied to Digital Systems Microstrip Transmission Line Techniques Evaluated Using TDR Measurements TDR Example 1 Given the following: Board material: Norplex Type G-10 Dielectric thickness: h = 0.062 inch; Copper thickness: t = 0.0014 inch; ε Dielectric constant: = 5.3.
- Page 251 Transmission Line Theory Applied to Digital Systems Microstrip Transmission Line Techniques Evaluated Using TDR Measurements Figure 11-8 TDR Determination of Line Characteristic Impedance Figure 11-9 TDR Determination of Line Characteristic Impedance (Continued) 11-23...
- Page 252 Transmission Line Theory Applied to Digital Systems Microstrip Transmission Line Techniques Evaluated Using TDR Measurements Figure 11-10 TDR Determination of Line Characteristic Impedance (Continued) The reflected voltage due to the connector is ±40 mV. The line reflects a voltage of ±25 mV due to variations in the characteristic impedance of the line. The reflection of 88 mV shown for the termination resistor (ρ...
- Page 253 Transmission Line Theory Applied to Digital Systems Microstrip Transmission Line Techniques Evaluated Using TDR Measurements Figure 11-11 Circuit for Determining the Maximum Reflected Voltage Due to the Inductance of the Resistor Leads where s is the LaPlace operator for jω. The driving voltage will be represented t ( ) mtu t ( ) m t T )u t T...
- Page 254 Transmission Line Theory Applied to Digital Systems Microstrip Transmission Line Techniques Evaluated Using TDR Measurements The maximum reflection voltage occurs at t = T . Then, for R = Z (21) -------- - T – -------- - 1 e –...
- Page 255 Transmission Line Theory Applied to Digital Systems Microstrip Transmission Line Techniques Evaluated Using TDR Measurements Figure 11-12 Effects Due to Termination Resistor Leads 11-27...
- Page 256 Transmission Line Theory Applied to Digital Systems Microstrip Transmission Line Techniques Evaluated Using TDR Measurements TDR Example 4 Experiments have also been performed to determine the effects of a ground plane on the characteristic impedance of microstrip lines. Figure 11-13 illustrates what happens when the ground plane width under the transmission line abruptly drops to the width of an active line.
- Page 257 Transmission Line Theory Applied to Digital Systems Microstrip Transmission Line Techniques Evaluated Using TDR Measurements Figure 11-14 shows a curve that approximates the change in the characteristic impedance of the line for various ratios of ground plane width to active line width.
- Page 258 Transmission Line Theory Applied to Digital Systems Microstrip Transmission Line Techniques Evaluated Using TDR Measurements A related experiment was performed to find the reflection due to a ground plane near the active line, but not directly under it. The test configuration and test results are shown in Figure 11-15.
- Page 259 4% is observed at point 2 where the junction occurs. Notice that the resistor exhibits a reflection of - 8%, due to capacitance of the resistor. The HP 54753A and HP 54754A TDR plug-ins’ normalization allows the user to change the risetime of the measurement system to simulate actual circuit risetimes.
- Page 260 Transmission Line Theory Applied to Digital Systems Microstrip Transmission Line Techniques Evaluated Using TDR Measurements Previously it was found that the 50 Ω resistor was inductive. The lower values of resistors (< 75 Ω) exhibit inductance, while the higher values behave capacitively.
- Page 261 Transmission Line Theory Applied to Digital Systems Microstrip Transmission Line Techniques Evaluated Using TDR Measurements Figure 11-17B shows the reflection due to the construction of Figure 11-17A where the two 100 Ω lines have been brought close together. The reflection at point 2 is now equal to 8% because the two lines are cross coupled.
- Page 262 Transmission Line Theory Applied to Digital Systems Microstrip Transmission Line Techniques Evaluated Using TDR Measurements The other, Z , is due to the strips being at equal but opposite potentials and carrying equal currents in opposite directions. The backward crosstalk voltage, , on a passive line is: (24) –...
- Page 263 Transmission Line Theory Applied to Digital Systems Microstrip Transmission Line Techniques Evaluated Using TDR Measurements Figure 11-18 Backward Crosstalk Coefficient for Microstrip Lines on Glass Epoxy Boards (G-10 Material) The backward crosstalk coefficient is equal to: (25) --------- - ------ - ...
- Page 264 Transmission Line Theory Applied to Digital Systems Microstrip Transmission Line Techniques Evaluated Using TDR Measurements TDR Example 6 The graph data in Figure 11-18 will be used to determine the percent of crosstalk coupling for the circuit of Figure 11-17. From the dimensions of the lines given in Figure 11-17 (a), K is found to be 0.055 from the graph.
- Page 265 Transmission Line Theory Applied to Digital Systems Microstrip Transmission Line Techniques Evaluated Using TDR Measurements Figure 11-19 Reflections Caused by Signal-Line Shape Variations 11-37...
-
Page 266: References
1 Resso, M., and Lee, M., "Evaluating Signal Integrity of IEEE 1394 Physical Layer with Time Domain Reflectometry", DesignCon99 Proceedings, High Performance System Design, February 1999 2 HP 54753/4 TDR Module User’s Guide, on-line accessible at http://www.tmo.hp.com/tmo/pia/lightwave/PIASupp/support/English/54753A _oper.html 3 "Evaluating Microstrip using TDR," Hewlett-Packard Application Note 1304-1, October 1998 "TDR Theory", Hewlett-Packard Application Note... - Page 267 Transmission Line Theory Applied to Digital Systems References 18 Botos, Bob, "Nanosecond Pulse Handling Techniques in I/C Interconnections", Motorola Application Note AN-270. 19 Schwarzmann, A., "Microstrip Plus Equations Adds Up to Fast Designs", Electronics, October 2, 1967, pp. 109-112 20 Catt, I., "Crosstalk (Noise) in Digital Systems". IEEE Transactions on Electronic Computers, Vol.
- Page 268 Transmission Line Theory Applied to Digital Systems References 11-40...
-
Page 269: Specifications And Characteristics
Specifications and Characteristics... - Page 270 Specifications and Characteristics This chapter lists specifications and characteristics of the HP 54753A, 54754A TDR plug-in module when it is combined with either the HP 83480A or HP 54750A mainframes. The specifications and characteristics for the mainframe are in the HP 83480A, 54750A User’s Guide. Specifications apply over the temperature range +15°C to +35°C (unless otherwise noted) after the...
-
Page 271: Specifications
Specifications and Characteristics Specifications Specifications The following are specifications used to test the HP 54753A, 54754A plug-in modules. Specifications are valid after a 60 minute warm-up period. See the HP 54701A Active Probe Service Guide for complete probe specifications. 12-3... -
Page 272: Vertical Specifications
Specifications and Characteristics Vertical Specifications Vertical Specifications − Bandwidth ( 3 dB) dc to 12.4 or 18.0 GHz , user selectable dc to 12.4 or 20.0 GHz, user selectable 3 4 5 dc Accuracy—single marker ± 12.4 GHz bandwidth 0.4% of full scale ±... -
Page 273: Environmental Specifications
2V + peak ac (+16 dBm) The input sampler is biased differently for increased bandwidth in the 18 GHz bandwidth mode. For the HP 54753A channel 2 only When operated within ±5°C (±9°F) of the temperature of the last plug-in calibration. -
Page 274: Power Requirements
1.1 kg (2.4 lb.) Shipping approximately 2.0 kg (4.4 lb.) Characteristics The following characteristics are typical for the HP 54753A and 54754A TDR plug-in modules. See the HP 54701A Active Probe Service Guide for complete probe characteristics. Trigger Input Characteristics... -
Page 275: Product Regulations
Specifications and Characteristics Product Regulations Product Regulations Safety IEC 1010 UL 3111 CSA Standard C22.2 No. 1010.1-92 This product meets the requirement of the European Communities (EC) EMC Directive 89/336/EEC. Emissions EN55011/CISPR 11 (ISM Group 1, Class A equipment) Immunity EN50082-1 Code Notes... - Page 276 12-8...
-
Page 277: In Case Of Difficulty
In Case of Difficulty... - Page 278 This chapter provides a list of suggestions for you to follow if the plug-in module fails to operate. A list of messages that may be display is also included. For complete service information, refer to the optional HP 54753A, 54754A Service Guide .
-
Page 279: If You Have Problems
Is the rear-panel line switch set to on? Will the mainframe power up without the plug-in module installed? If the mainframe still does not power up, refer to the optional HP 83480A, 54750A Service Guide or return the mainframe to a qualified service department. -
Page 280: If The Plug-In Does Not Operate
In Case of Difficulty If the Plug-in Does Not Operate If the Plug-in Does Not Operate Make the following checks: Is the plug-in module firmly seated in the mainframe slot? • Are the knurled screws at the bottom of the plug-in module finger-tight? •... -
Page 281: Error Messages
If the suggestions do not eliminate the error message, then additional troubleshooting is required that is beyond the scope of this book. Refer to the optional HP 54753A, 54754A Service Guide and HP 83480A, 54750A Service Guide for additional troubleshooting information. - Page 282 An illegal hardware state is detected at the mainframe to plug-in module interface of the specified slot. If the slot is empty, there is a mainframe hardware problem. Refer to the HP 83480A, 54750A Service Guide. If a plug-in is installed in the slot, there is a plug-in module hardware problem.
- Page 283 Index Numerics connector measuring excess L/C 7-32 accuracy 2-6 measuring impedance 7-19 2 only stimulus alignment 2-4 measuring percent reflection 7- menus 5-13 connecting devices 2-16 dimensions 2-10 normalization 7-8 accuracy performance 1-5 disconnecting devices 2-6, 2-7 single-ended TDR 7-3 active probe 3-5 inspection 2-4 excess L/C 7-6...
- Page 284 Index marker value 3-6 3-17 percent reflection 7-7 markers power level 3-5 Scale softkey 3-4 reference plane 5-10, 5-21 power requirements 12-6 scaling math function 3-4 Preset TDR/TDT 7-3, 8-3 normalization 5-14, 5-32 measuring Preset TDR/TDT softkey 4-8, 5-12, changing 5-20 capacitance 7-6 5-17, 5-22, 5-28, 5-34 horizontal 5-14, 5-20, 5-32...
- Page 285 1-5 TDR/TDT Measure measurement 3-7 menus 6-4 scale 3-4 TDR/TDT Setup menu 4-4 specifications 12-4 HP 54754A 5-7 waveform 3-5 TDR/TDT softkey 4-6, 5-9, 5-14, 5- Vertical sofkey 5-10 19, 5-23, 5-31 Vertical softkey 4-6, 5-14, 5-20, 5- 23, 5-32...
- Page 286 Index Index-4...
- Page 287 © Copyright Hewlett- Safety • Service instructions are for Safety Symbols Packard Company 1999 All trained service personnel. To This apparatus has been Rights Reserved. avoid dangerous electric designed and tested in accordance with IEC shock, do not perform any Instruction manual symbol: Publication 1010, Safety Reproduction, adaptation, or...
-
Page 288: Publication Number
This Hewlett-Packard This is the second edition of Hewlett-Packard specifically edition and of any changed product has a warranty the HP 54753A and HP disclaims the implied pages to that edition. against defects in material 54754A TDR Plug-in Modules warranties of and workmanship for a User's Guide.