Table of Contents
Advertisement
Quick Links
Advertisement
Table of Contents

Related Manuals for HP 86037B


Summary of Contents for HP 86037B
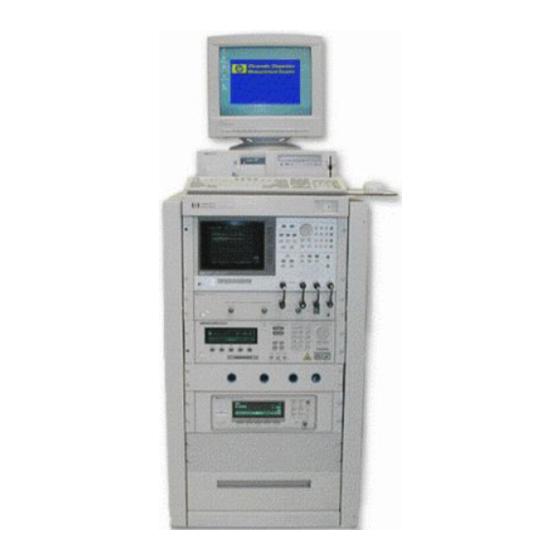
- Page 1 User’s Guide HP 86037B Chromatic Dispersion Test System...
- Page 2 Hewlett-Packard Com- remedies. Hewlett-Packard tions of the instrument pany will, at its option, either shall not be liable for any HP Part No. 86037-90017 power line switch. repair or replace products direct, indirect, special, inci- Printed in USA which prove to be defective.
- Page 3 HP with reasonably detailed the applicable FAR or DFARS Customer must notify govern your use of the accom- information regarding any dis- clause or the HP standard Hewlett-Packard in writing of panying Software unless you assembly or decompilation. software agreement for the...
-
Page 4: General Safety Considerations
If the Agreement requires that specific HP Products must perform as a system in accordance with the foregoing war- ranty, then that warranty will apply to those HP products as a system, and Customer retains sole responsibility to ensure the Year 2000 readiness of its information technology and business environment. -
Page 5: Table Of Contents
TES Min/Max Parameters 4-38 Output Parameters 4-41 5 Maintenance Troubleshooting Common Problems 5-3 Verification Tests 5-9 Reinstalling the System Software 5-16 HP Support and Maintenance 5-18 Cleaning Connections for Accurate Measurements 5-20 Electrostatic Discharge Information 5-31 Returning the Instrument for Service 5-33 Contents-1... - Page 6 Contents Hewlett-Packard Sales and Service Offices 5-36 6 Installation 7 Reference Theory of Operation 7-2 Rack Diagram 7-6 Chromatic Dispersion–theory and management 7-8 Measurement Repeatability 7-11 Material Lists 7-13 Power Cords 7-18 System Options 7-19 8 Specifications and Regulatory Information Specifications 8-3 Regulatory Information 8-7 Contents-2...
-
Page 7: Quick Start
Operation—at a glance 1-2 A Quick Tour 1-4 Measuring Fiber Devices 1-8 Measuring Grating Devices 1-11 Quick Start... - Page 8 The system performs near-end measurements where there is access to both ends of a test device at the same location. Your HP 86037B should have already been installed by an HP engineer. If in the future, you should need to review the installation procedures, refer to Chapter 6, “Installation”.
- Page 9 Operation—at a glance W A R N I N G HP 86037B and HP 83427A: If the system or test set products are not used as specified, the protection provided by the equipment could be impaired. These products must be used in a normal condition (in which all means for protection are intact) only.
-
Page 10: A Quick Tour
System power switch 2 When the Windows desktop appears, click on the HP CD icon. 3 The two procedures listed below should have been performed as part of the system installation procedure. If they have not yet been performed, perform them at this time. - Page 11 7 On the SetParametersFor menu, click CD/ Gain Meas. In the dialog box, click Set HP Defaults and then OK. 8 On the SetParametersFor menu, click Length Meas. In the dialog box, click Set HP Defaults and then OK.
- Page 12 Quick Start A Quick Tour 9 On the File menu, click Save Setup As to save all of the settings made so far into a setup file. The title bar displays the name of the setup file that is currently open. You can recall this file at any time to automatically configure the system to your spe- cific measurement settings.
- Page 13 Quick Start A Quick Tour Messages in the status line (located at the bottom of the display) show the test’s progress. After a few seconds, the Data Monitor window appears. While the test is in progress, you can toggle the views between displayed graph and list panes.
-
Page 14: Measuring Fiber Devices
Quick Start Measuring Fiber Devices Measuring Fiber Devices In this section, you’ll learn how to optimize measurements on fiber devices. You can, of course, skip this section and immediately begin making measure- ments on your devices. However, be sure to read this material later to increase your understanding of chromatic dispersion measurements. - Page 15 Quick Start Measuring Fiber Devices is 2 GHz. is 0.07 ps/(nm 2 ×km). λ is 60 nm . SPAN L is 70 km. Substituting these values into the above equation, we have: 5 0 0 (∆λ) 0 .0 7 p s M A X X 2 G H z X 6 0 n m X 7 0 k m Note that 0.85 nm is the maximum allowed step size.
- Page 16 Quick Start Measuring Fiber Devices Assumptions required for this optimization method Assumption 1. The group delay can be modeled by the quadratic equation: τ (λ) = (λ − λ ο is the dispersion slope, λ is the wavelength, λ Where S is the zero dispersion wave- length, and L is the fiber length.
-
Page 17: Measuring Grating Devices
In this section, you’ll learn how to make measurements on grating based devices such as Bragg fiber gratings. It is recommended that you do not skip this section. Since the HP 86037B, by default, is set for making measurements on fiber devices, before measuring grating devices, perform the following... - Page 18 Quick Start Measuring Grating Devices Without the benefit of curve fitting and since dispersion is the derivative of the group delay, the effect of any noise is exaggerated. For example, large amounts of noise will be measured at wavelengths in a filter’s cutoff region. 5 Use a 2 GHz RF modulation frequency with a small wavelength step size.
-
Page 19: Operation
The Main Window 2-3 Test and Tool buttons 2-5 Wavelength Selection area 2-6 Test Identification area 2-8 Normalization area 2-9 Measurement Speed Parameters area 2-10 Fiber Related Parameters area 2-12 Grating Related Parameters area 2-14 File menu 2-15 SetParametersFor menu 2-15 Range menu 2-18 System menu 2-19 Service menu 2-22... - Page 20 Operation Operation—at a glance Operation—at a glance In this chapter, you’ll find descriptions of the chromatic dispersion applica- tion’s two window views along with their menu selections. The two window views (main and data review) are each described in a separate section. Addi- tional sections describe database files and test fiber stability.
-
Page 21: The Main Window
Operation The Main Window The Main Window This section describes the settings and features located in the main window. You’ll make all of your measurements from the main window. After performing your measurement, you can switch between the main and data review win- dows with the click of a button. - Page 22 Operation The Main Window Where to find information on . . . Wavelength Menu bar Test identification area Selection Normalization area Test and Tool Buttons Fiber Related Parameters Grating Related Parameters Measurement Speed Parameters Main Window Refer to..“Test and Tool buttons” on page 2-5 “Wavelength Selection area”...
- Page 23 Operation The Main Window Test and Tool buttons Button Description Click to bias the modulator. To learn about biasing the modulator and normalizing your measurements, refer to Chapter 3, “Normalization”. Click to remove any systematic effects of the test setup from the measurements.
- Page 24 The HP 86037B application does not indicate an error. The shaded area in Fig-...
- Page 25 Operation The Main Window points, or steps, the greater the measurement accuracy. However, as the num- ber of steps increases, so does the measurement time. It is important to select enough steps to provide the required accuracy, but still allow for a timely mea- surement.
- Page 26 Operation The Main Window Test Identification area Use the test identification area to identify the device being measured along with the operator who runs the test. This information is stored with the test measurement results. You can also change the labels that are used to identify each field.
- Page 27 Operation The Main Window Normalization area After you perform a device normalization (as described in “Normalizing the Test Setup” on page 3-4), you can apply it to your measurements by selecting it from the main window’s Normalization area. These normalizations remove any systematic effects of the test setup from your measurements.
- Page 28 Operation The Main Window Measurement Speed Parameters area The Measurement Speed Parameters area allows you to adjust measurement times based upon the number of acquired measurement data points at each wavelength step. These are the measurement points used by the system’s net- work analyzer.
- Page 29 Operation The Main Window By adjusting the measurement speed and sensitivity settings, you can opti- mize your measurements for your requirements. For example, you could design a fast test for broadband fiber measurement and a high accuracy test for narrow-band grating measurements. 2-11...
- Page 30 Operation The Main Window Fiber Related Parameters area The two selections available in the Fiber Related Parameters area allow you to con- figure measurements of fiber-optic cables. Length area Measure Enables the measurement of the length of the fiber-optic cable. Be sure to enter the cable’s refractive index in the n = field.
- Page 31 Operation The Main Window Figure 2-4. Repeat Measurement Selector 2-13...
- Page 32 For more information on measuring grating-based devices, refer to “Measuring Grating Devices” on page 1-11. TLS Wavelength Feedback Mode If your system includes an HP 86120 multi-wavelength meter, you can use this area to increase wavelength accuracy of the measurement results. Mea- surement speed, however, will be increased.
- Page 33 The .cds filename extension is automatically added to the filename. SetParametersFor menu CD/Gain Meas command Set HP Defaults button Sets the default settings. Test and Reference Modu- lation Frequencies Sets the RF frequencies used...
- Page 34 Operation The Main Window TLS Target Power Use this setting to specify the power level of the tunable laser source. Avoid entering power levels beyond the capability of the tunable laser source. Sensitivity You can select from Normal, High, and Highest settings. Increasing sensitivity reduces noise but increases the measurement time.
- Page 35 Use this selection to copy the calibration wavelength limits to the wavelengths used for the measurement. If the values are identical, this feature eliminates the need to enter the wavelength limits twice. Length Meas command HP Defaults This button sets the dialog box to its default settings. TLS Wavelength and TLS...
- Page 36 Operation The Main Window Number of Measurements Use this entry to set the number of measurements required to determine the length. Normalization command Refer to Chapter 3, “Normalization” for information on using the Normaliza- tion command. Range menu On dual-band systems, use the selections in the Range menu to select the mea- surement band.
- Page 37 Operation The Main Window System menu Addresses command On the System menu, click Addresses to view the GPIB addresses for all of the instruments in the system. These addresses are set at the factory and should not be changed. 2-19...
- Page 38 Operation The Main Window Database Options command The HP 86037B places settings and measurement results in a database. To learn about managing the database, refer to “Using Database Files” on page 2-33. Record Labels command Using the Record Labels command, you can change the test identification labels to suit your needs.
- Page 39 Operation The Main Window To change these labels Click Edit names, and edit the fields in the dialog box Figure 2-5. Changing the test information labels 2-21...
- Page 40 For safety reasons, the system is shipped from HP with the lasers set to off. Pause between wavelength ranges command Click Pause between wavelength ranges command to set or clear the check mark.
-
Page 41: The Review Data Window
Operation The Review Data Window The Review Data Window Clicking Review Data in the main window displays the Review Data window for viewing your measurement data. To return to the main window, simply click the Return to Main button. See Figure 2-7 on page 2-24. - Page 42 Operation The Review Data Window Select curve fit Menu bar algorithm for group delay Print measurement results Return preferred wavelengths to default values Normalize dispersion by length in km Return to main window Five tabs showing Data listed at eight alternate views of user preferred measurement data...
- Page 43 Operation The Review Data Window Measurement review tabs The CD Graphs tab This view displays two graphs of the measurement results. The top graph shows the relative group delay points and fitted curve. The bottom graph shows the computed dispersion. Dis- persion points are computed from pairs of group delay points and are displayed midway between the corre-...
- Page 44 Operation The Review Data Window The amount of scatter of the directly calculated dispersion has minimal impact on the accuracy of the zero- dispersion wavelength because the zero-dispersion wavelength is obtained from the fitted curve. When the wavelength step is very small (less than about 0.01 nm), and a wavelength meter is used with the system, it is possible for two or more...
- Page 45 Operation The Review Data Window The CD Statistics tab The displayed results give a statisti- cal analysis of a single group of two or more tests. The top table lists the statistics for λ (lambda zero) and the dispersion slope at λ .
- Page 46 Operation The Review Data Window relative group delay measurements. Use the option buttons above the tables to change the type of curve fit. The statistics for the five-term Sellmeier fit can contain multiple zero-dispersion wavelengths. To view them, scroll horizon- tally across the displayed data.
- Page 47 Operation The Review Data Window File menu Print command The Print command displays the Print Range dialog box from which you can print the measurement results. You can select items to be included when printed. Export Data command You can easily export your measurement results to your spreadsheet application or word processor.
- Page 48 Operation The Review Data Window Table 2-4. Data Included in Spreadsheet File Data Type Description Group Delay, measured List of measured group delay in raw data format. Group Delay, fitted List of measured group delay using the curve fit selected in the Data Review view. Gain List of gain measured at each wavelength.
- Page 49 Operation The Review Data Window Table 2-4. Data Included in Spreadsheet File (Continued) Data Type Description Test Data and Time Time, date, supervisor, and user information. Column Headings Includes label for each column of data. Statistics for Groups All information shown in the CD Stats tab of the Data Review view. 2-31...
- Page 50 Operation The Review Data Window Edit menu You can use the edit menu to copy chromatic dispersion measurement data to the Windows NT clipboard. Once the data is copied to the clipboard, you can easily paste it into other applications such as a word processor. 1 In the Review Data view, click on the CD List or Gain List tabs.
-
Page 51: Using Database Files
Using Database Files Using Database Files The HP 86037B maintains all measurement results and settings in a database. The initial database is located in the hpcd/customer folder on the computer’s drive C. Until you create a new database, results for each of your measure- ments will be contained in this initial database file. - Page 52 Operation Using Database Files Move Data to Archive command Large database files are slow and require time to store and retrieve data. The database archive feature helps you manage the size of your database files by moving test data from the currently opened database file to another database file.
- Page 53 Operation Using Database Files Compact Database command A currently opened database file can be compacted to reduce the amount of disk space it occupies. A database file must be open before it can be com- pacted. The function returns an error if the database file is read-only. Com- pacting is automatically performed when a database file is repaired.
-
Page 54: Checking Test Fiber Stability
3 When the modulator bias adjustment is complete, remove the thru fiber and connect the fiber to be tested between the test ports. 4 On the front panel of the HP 8168 tunable laser source, press the LOCAL key. When you complete this procedure and return to using the mouse or key- board, control of the instruments return to the HP 86037B. - Page 55 Operation Checking Test Fiber Stability The displayed trace is a history of the modulation phase over the selected time period (sweep time). 13 Press SCALE/REF, and enter a value in degrees that is equal to the fiber-optic cable’s index of refraction. For example, if the index of refraction is 1.45, enter 1.45°.
- Page 56 Operation Checking Test Fiber Stability Measurement theory Stability is examined by measuring modulation phase at the output of the test fiber rela- tive to the electrical modulation source, as a function of time. The change in group delay required to produce a change in modulation phase is given by: C h an g e in p ha s e ∆τ...
-
Page 57: Normalization
Normalizing the Test Setup 3-4 Verifying a Test Setup Normalization 3-6 Adjusting the Modulator Bias 3-7 Normalizing the Laser 3-8 Adjusting the Power Monitor 3-10 Setting Normalization Preferences 3-13 Normalization... - Page 58 Normalization Normalization Normalization Normalization removes any systematic effects of the test setup from the mea- surements. The normalization path must include any fiber-optic patch cables used to connect the device being tested to the front-panel SOURCE OUTPUT and RECEIVER INPUT connectors. As Table 3-1 shows, there are two different normal- ization procedures and two adjustments that are necessary.
- Page 59 Normalization Normalization Because normalization data is saved in a file, it can be recalled and used at a later time. It is sometimes possible to use normalization files four or five days old and still obtain good measurement results. When in doubt, click the Nor- malization Verification button to quickly check the quality of the normaliza- tion.
-
Page 60: Normalizing The Test Setup
Normalization Normalizing the Test Setup Normalizing the Test Setup 1 Click New Normalization. 2 Select the name of the normalization device from the Select Normalization Device field or highlight a name in the list box. To add another normalization device, click on Add Normalization Device. - Page 61 Normalization Normalizing the Test Setup 7 Start the normalization by clicking the Start Normalization. A normalization takes 5 to 10 minutes to complete, depending on the number of steps selected. During normalization, the status message “Normalizing. Please stand by...” is shown at the bottom of the display. The data monitor graph is visi- ble during actual collection of the normalization data.
-
Page 62: Verifying A Test Setup Normalization
Normalization Verifying a Test Setup Normalization Verifying a Test Setup Normalization Before a measurement session, it is a good idea to verify the current normal- ization. Verification does not need to be performed before each measurement. 1 Connect the appropriate normalization device, such as a short fiber-optic cable, between the SOURCE OUTPUT and RECEIVER INPUT connectors. -
Page 63: Adjusting The Modulator Bias
Normalization Adjusting the Modulator Bias Adjusting the Modulator Bias 1 On the System menu, confirm that the Wavelength Meter command is checked. The checkmark can be toggled on and off by clicking the command. 2 Connect a short "through" fiber-optic cable between the front-panel SOURCE OUTPUT to RECEIVER INPUT connectors. -
Page 64: Normalizing The Laser
4 In the displayed dialog box, click the appropriate button to enable the tunable laser source. For safety reasons, the default value is OFF. 5 On the SetParametersFor menu, click CD/ Gain Meas. In the dialog box, click Set HP Defaults and then click OK. 6 Click New Normalization. - Page 65 11 When the graph display closes and the message area indicates Ready, close the New Normalization window. 12 Click Verify Normalization to confirm that the normalization data is valid. If the verification does not pass, note the maximum group delay value obtained, and report the failure to HP.
-
Page 66: Adjusting The Power Monitor
Normalization Adjusting the Power Monitor Adjusting the Power Monitor Perform this procedure when the system is first installed; it does not need to be performed before each individual measurement. In the following proce- dure, you’ll need an optical power meter. 1 On the System menu, confirm that the Wavelength Meter command is checked. - Page 67 : ..........____________ dBm 10 Disconnect the fiber-optic cable from the power meter and connect it to the RECEIVER INPUT port on the HP 83427A test set. 11 Click the Power Monitor button on the main window and record the power reading P : .
- Page 68 Normalization Adjusting the Power Monitor control. Adjusting the Low Band values Perform the following steps only if you have a dual band system. 20 Repeat the adjustment for the low band. Set the optical power meter to 1308 nm when reading low band power. Enter the following values into the Power Monitor Setup under the 1300 nm column.
-
Page 69: Setting Normalization Preferences
It measures the length of the "through" cable and stores it for later use. Figure 3-3. Normalization Settings Window Set HP Defaults Selects the system’s default values. 3-13... - Page 70 Normalization Setting Normalization Preferences Modulation Frequency RF frequencies used to modulate the optical signal in the test and reference measurement operations. TLS Target Power The level requested of the tunable laser source. If it cannot supply the full amount, it will supply as much as it can. Average Factor Controls the number of network analyzer sweeps which are averaged to mea- sure group delay at each wavelength point.
- Page 71 Normalization Setting Normalization Preferences imum “thru” length you expect to use. For example, if the maximum "thru" length in your factory is 120 meters, enter 0.5 km to avoid potential problems with length normalization. 3-15...
- Page 72 Normalization Setting Normalization Preferences 3-16...
-
Page 73: Remote Control
Setting up a Measurement 4-4 Performing a Measurement 4-13 Reading the Measurement Results 4-16 TES Parameters 4-21 TES Min/Max Parameters 4-38 Output Parameters 4-41 Remote Control... - Page 74 • Microsoft Access 97 , another database tool, or Visual Basic Professional 5.0. Use this software to access the Results.mdb database. The HP example code in- cluded with the system uses Visual Basic and SQL commands. *. Visual Basic is a product of Microsoft Corporation.
- Page 75 Figure 4-1. Figure 1: Overview of remote interaction Measurement execution on the HP 86037B is controlled via a test executive shell (TES) that is contained in the file TESServer.dll. Your remote application uses the TES to edit test parameters and start tests. Measurement results are retrieved independently of the test executive.
-
Page 76: Setting Up A Measurement
The test parameter database file, testparm.mdb, is a complicated structure. C A U T I O N Damage to the file can render the HP 86037B unusable until the database is replaced or repaired. For this reason, direct access of the testparm.mdb database is not recommended or supported by HP. - Page 77 Typically, the path of the io and security databases are left at the C:\HPCD directory of the remote machine while the location of the test parame- ter and results databases are set to the location of the HP 86037B system that is to be controlled.
- Page 78 Remote Control Setting up a Measurement When the test parameter editor is started, the first action is to login to the TESServer.dll: ‘First create an instance of the TESManager Set TESMngr = New TESManager 'Open the TESManager session TESMngr.OpenSession If the TESServer.dll is not found, check that it is registered under the “project\references”...
- Page 79 “Edit the test param- eters” on page 4-11. Example for obtaining collections for a given test group ‘This line returns the active system, i.e. HP 86037B m_sActiveSystem = m_oController.ActiveSystem ‘This line sets the active test plan, always “Standard_Test_Plan” m_sActiveTestPlan = "Standard_Test_Plan"...
- Page 80 Remote Control Setting up a Measurement The add_test subroutine Public Sub add_test(str, Optional bReport = False) ' Purpose: Adds the test name to the collection of tests to be run. ' Used when getting TES parameter collections. Dim sTestName As Variant Dim rsTestTable As Recordset Dim oTest As TestObjDataType With TESMngr.ParmMngr...
- Page 81 Remote Control Setting up a Measurement Note that it is also possible for the user to access the collections for the Sys- tem, Test Plan, or Test Group levels individually. In this case one of the follow- ing methods can be used: TESMngr.ParmMngr.LoadSystemParms colSystemParms, ""...
- Page 82 Remote Control Setting up a Measurement Complete test plan hierarchy Systems: Customer_Dual_Band Customer_High_Band Customer_Low_Band Test Plans: Standard_Test_Plan Groups & Tests: Initialize Read_TLS_Specs Start_Test Test_Connect Test_Length Test_Gain_Phase Test_CD Add_Run_Number Modulator_Bias Mod_Bias_Connect Mod_Bias_Adjust_LB Mod_Bias_Adjust_HB New_Calibration Cal_Connect Mod_Bias_Adjust_LB Mod_Bias_Adjust_HB Cal_Length Cal_Gain_Phase Cal_Processing Add_Run_Number Verify_Calibration Verify_Connect Mod_Bias_Adjust_LB...
- Page 83 Remote Control Setting up a Measurement Edit the test parameters This section describes the editing of individual collection parameters. As an example of a collection, consider colParms which is a collection of parameter objects, one for each parameter accessed in an example test. The parameter objects are collections of variables containing information about an individual parameter.
- Page 84 Remote Control Setting up a Measurement Save the test parameters When editing is complete, any changes need to be written to the parameter database. The subroutine StoreLevelParms requires that the first parameter be a collection and the second be an integer corresponding to the level in the test plan hierarchy.
-
Page 85: Performing A Measurement
Windows NT 4.0 system, using the software located in the C:\HPCD\ RELATED INSTALLATIONS\RSH directory. 2 Setup and initiation of the remote shell services software on the HP 86037B. To install this software (a product of Denicomp Systems), follow the instructions provided in the supplied software package. - Page 86 Mode awaiting a message from a Client, in our case the user software running on the remote machine. Since the development of the remote test control pro- gram is the responsibility of the user, HP provides only a simple example con- trol program that demonstrates the use of the communication function to connect to MsgCenter, start a given test, abort a running test, and close Msg- Center.
- Page 87 Message Server The Message Server within the HP 86037B is automatically invoked by the login to the test executive. After opening a window titled MsgCenter, its initial action is to connect to socket 4444. When the connection is completed the Message Server then awaits a read event on the socket.
-
Page 88: Reading The Measurement Results
Remote Control Reading the Measurement Results Reading the Measurement Results You can read results database, results.mdb, directly by using a variety of tech- niques. The approach documented here uses SQL commands implemented in a Visual Basic example program. As in the test parameter database, communi- cation is via a network connection to the system hard drive. - Page 89 Remote Control Reading the Measurement Results Figure 4-2. Relationship between the three tables of the results.mdb database. First, open the results database with the following lines of code: Private m_dbResults As Database dbPath = txtDBPath & "\Results.mdb" ' Open the results database Set m_dbResults = OpenDatabase(dbPath, False, True) ' Open database as shared, read-only The results database has three linked tables, DUTInfo, TestInfo, and Parameter.
- Page 90 Remote Control Reading the Measurement Results where rsReportID will contain all of the rows of the first table DUTInfo which con- tain information about all of the runs where the Test Group name is “New_Calibration” and the test result is “PASSED”. Looping through all the members of the recordset one then extracts all of the TestIDs related to those members.
- Page 91 Remote Control Reading the Measurement Results The GetParm subroutine The routine GetParm is given by the following: Public Function GetParm(rsData As Recordset, sParmName As String) As Variant ' Caution: All non-array values are returned as strings. Thus if you are getting a number, it may be necessary for you to use Val(GetParm()) so that the parameter is converted to a number.
- Page 92 Remote Control Reading the Measurement Results The ByteArrayToVariant subroutine Private Function ByteArrayToVariant(ByRef btByteArray() As Byte) As Variant ' Purpose: The data has ' to be assigned to variable length byte array first, and then converted ' to variant via binary file operation. Dim sTempFilename As String Dim iTempFileNum As Integer Dim avParm As Variant...
-
Page 93: Tes Parameters
The table defines parameters for a high band system. Parameters with the “_HB” at the end are parameters that depend upon the type of HP 86037B Chromatic Dispersion Test System (1300, 1500, or DUAL). For a Low Band system, the “_HB”... - Page 94 Remote Control TES Parameters Main chromatic dispersion screen 4-22...
- Page 95 Remote Control TES Parameters Table 4-2. Main Chromatic Dispersion Screen (1 of 3) Parameter Location Item TES Name Data Type Comments in Database Device_Name_1 System String Device_Name_2 System String Device_Name_3 System String Test_Manager_List System String Array Selected item will be put in Test_Manager (0:99) TES parameter.
- Page 96 Remote Control TES Parameters Table 4-2. Main Chromatic Dispersion Screen (2 of 3) Parameter Location Item TES Name Data Type Comments in Database Tests_Per_Group Group: Start_Test Integer This parameter can be modified in two ways: 1. Pressing the Change” button brings up the Test: Test_Gain_Phase Repeat Measurement Selector GUI.
- Page 97 Remote Control TES Parameters Table 4-2. Main Chromatic Dispersion Screen (3 of 3) Parameter Location Item TES Name Data Type Comments in Database Filter System Boolean Selected by operator in Enabled” checkbox in the Filter Measurement”. True = Filter measurement selected. False = Filter measurement not selected.
- Page 98 Remote Control TES Parameters Menu Bar Selections Table 4-3. Menu Bar Selections Parameter Location Item TES Name Data Type Comments in Database Use_Wavemeter System: Boolean The item Wavemeter” is checked or unchecked. True = item checked (measure wavelength with wavelength meter). False = item unchecked Pause_Measurement Group: Start_test...
- Page 99 Remote Control TES Parameters System Record Labels Dialog Box Table 4-4. System Preferences Dialog Box Item TES Name Parameter Location in Database Data Type Comments Title_1 System String Fiber Title_2 System String Cable Title_3 System String Segment Title_4 System String Test Manager Title_5 System...
- Page 100 Remote Control TES Parameters CD and Gain Measurement Settings Dialog Box 4-28...
- Page 101 Remote Control TES Parameters Table 4-5. CD and Gain Measurement Settings Dialog Box Item TES Name Parameter Location Type Comments Test_Mod_Frequency_HB Group: Start_Test Single Test: Test_Gain_Phase Ref_Mod_Frequency_HB Group: Start_Test Single Test: Test_Gain_Phase Auto_Mod_Freq Group: Start_Test Boolean True = Auto selected. False = Manual selected Test: Test_Gain_Phase Do_Gain...
- Page 102 Remote Control TES Parameters Length Measurement Settings Dialog Box 4-30...
- Page 103 Remote Control TES Parameters Table 4-6. Length Measurement Settings Dialog Box Item TES Name Parameter Location Type Comments TLS_Wavelength Group: Start_Test Single Test: Test_Length TLS_PowerLevel Group: Start_Test Single Test: Test_Length VNA_AverageFactor Group: Start_Test Integer Test: Test_Length VNA_IFBandwidth Group: Start_Test Integer This parameter is “Sensitivity”...
- Page 104 Remote Control TES Parameters Normalization Settings Dialog Box 4-32...
- Page 105 Remote Control TES Parameters Table 4-7. Calibration Settings Dialog Box Item TES Name Parameter Location Type Comments Test_Mod_Frequency_H Group: New_ Calibration Single Test: Cal_Gain_Phase Group: Verify_Calibration Test: Verify_Gain_Phase TLS_PowerLevel_HB Group: New_ Calibration Single Test: Cal_Gain_Phase Group: Verify_Calibration Test: Verify_Gain_Phase VNA_AverageFactor_HB Group: New_ Calibration Integer Test: Cal_Gain_Phase...
- Page 106 Remote Control TES Parameters New Normalization Button Dialog Box 4-34...
- Page 107 Remote Control TES Parameters Table 4-8. New Normalization Button Dialog Box Item TES Name Parameter Location Type Comments Cal_Device Group: String Array Drop down list of text entries for Cal New_Calibration Device. Selected by the operator. (0:99) Selected item will be put in Selected_Device TES parameter.
- Page 108 Remote Control TES Parameters Power Monitor Setup Dialog Box Table 4-9. Power Monitor Setup Dialog Box Item TES Name Parameter Location Type Comments PowerConstant_HB Group: Power Monitor Single Test: Power Monitor Under_Range_Limit_HB Group: Power Monitor Single Test: Power Monitor Insertion_Loss_Ref_HB Group: Power Monitor SIngle Test: Power Monitor...
- Page 109 Remote Control TES Parameters Various System Parameters Table 4-10. Various System Parameters Item TES Name Parameter Location Type Comments Setup_Path System: String Path name where setup database files are located. Path entered here will be used by File pull-down list on Main GUI.
-
Page 110: Tes Min/Max Parameters
Remote Control TES Min/Max Parameters TES Min/Max Parameters Table 4-11 defines the TES parameters in the database that are utilized by the GUI to check values entered in the GUI. All of these parameters are located at the “System” level. The table shows the parameters for a dual band system. For a single band system the parameters with “_LB”... - Page 111 Remote Control TES Min/Max Parameters Table 4-11. TES GUI Min/Max Parameters (2 of 3) TES Name Type Value Unit Description Vfy_MaxTemp Real32 100000 Degrees C Max Temperature limit for GUI Vfy_MaxTLSPwr_HB Real32 9.948 Max TLS Power Level for GUI Vfy_MaxTLSPwr_LB Real32 1.501 Max TLS Power Level for GUI...
- Page 112 Remote Control TES Min/Max Parameters Table 4-11. TES GUI Min/Max Parameters (3 of 3) TES Name Type Value Unit Description Vfy_MinCalLim Real64 Min Verify Cal limit for GUI Vfy_MinLen Real64 0.001 Min Length limit for GUI Vfy_MinLenRepeat Int32 Min No. of Length meas. limit for GUI Vfy_MinMaxCalLen Real64 Min Length limit for Cal for GUI...
-
Page 113: Output Parameters
Remote Control Output Parameters Output Parameters Table 4-12 Table 4-13 give the names of the output parameters in the results.mdb database sorted by the type of system (single or dual band). For a single band 1300nm system, use the single band standard (1500nm) system names replacing the “_HB”... - Page 114 Remote Control Output Parameters Table 4-12. Output Parameters – Customer_High_Band (2 of 3) Standard_Test_Plan Data Type Unit Description TLSPower_HB(1,1,1) Real64 TLS power for each meas Wavelength_HB(1,1,1) Real64 Gain/Phase meas wavelength array Test_CD Dispersion_Coeff3Term_HB(1,1,1) Real64 Dispersion_Coeff5Term_HB(1,1,1) Real64 Dispersion_CoeffQuad_HB(1,1,1) Real64 Dispersion_Measured_HB(1,1,1) Real64 ps/nm Dispersion_Wavelength_HB(1,1,1) Real64...
- Page 115 Remote Control Output Parameters Table 4-12. Output Parameters – Customer_High_Band (3 of 3) Standard_Test_Plan Data Type Unit Description ZeroWL_Quad_HB(1,1,1) Real64 ZWLSlope_3Term_HB(1,1,1) Real64 nm² ZWLSlope_5Term_HB(1,1,3) Real64 nm² ZWLSlope_Quad_HB(1,1,1) Real64 nm² 4-43...
- Page 116 Remote Control Output Parameters Table 4-13. Output Parameters – Customer_Dual_Band (1 of 4) Standard_Test_Plan Data Type Unit Description Test Length CableLength Real64 Cable length measured (average for multiples) CableLengthMeasurements(50) Real64 Array of length measurements for multiples Test_Gain_Phase AbsGDelay_HB(1,1) Real64 Absolute Group Delay at Stop Wavelength AbsGDelay_LB(1,1) Real64 Absolute Group Delay at Stop Wavelength...
- Page 117 Remote Control Output Parameters Table 4-13. Output Parameters – Customer_Dual_Band (2 of 4) Standard_Test_Plan Data Type Unit Description Test_CD Dispersion_Coeff3Term_DUAL(1,1,1) Real64 Dispersion_Coeff3Term_HB(1,1,1) Real64 Dispersion_Coeff3Term_LB(1,1,1) Real64 Dispersion_Coeff5Term_DUAL(1,1,1) Real64 Dispersion_Coeff5Term_HB(1,1,1) Real64 Dispersion_Coeff5Term_LB(1,1,1) Real64 Dispersion_CoeffQuad_DUAL(1,1,1) Real64 Dispersion_CoeffQuad_HB(1,1,1) Real64 Dispersion_CoeffQuad_LB(1,1,1) Real64 Dispersion_Measured_DUAL(1,1,1) Real64 ps/nm Dispersion_Measured_HB(1,1,1) Real64 ps/nm...
- Page 118 Remote Control Output Parameters Table 4-13. Output Parameters – Customer_Dual_Band (3 of 4) Standard_Test_Plan Data Type Unit Description Number_Steps_LB Int16 Phase_Coeff3Term_DUAL(1,1,1) Real64 Phase_Coeff3Term_HB(1,1,1) Real64 Phase_Coeff3Term_LB(1,1,1) Real64 Phase_Coeff5Term_DUAL(1,1,1) Real64 Phase_Coeff5Term_HB(1,1,1) Real64 Phase_Coeff5Term_LB(1,1,1) Real64 Phase_CoeffQuad_DUAL(1,1,1) Real64 Phase_CoeffQuad_HB(1,1,1) Real64 Phase_CoeffQuad_LB(1,1,1) Real64 Phase_StdDev3Term_DUAL(1,1) Real64 Phase_StdDev3Term_HB(1,1) Real64 Phase_StdDev3Term_LB(1,1)
- Page 119 Remote Control Output Parameters Table 4-13. Output Parameters – Customer_Dual_Band (4 of 4) Standard_Test_Plan Data Type Unit Description Wavelength_Corrected_DUAL(1,1,1) Real64 Wavelength_Corrected_HB(1,1,1) Real64 Wavelength_Corrected_LB(1,1,1) Real64 WL_GainPeak_DUAL(1,1) Real64 WL_GainPeak_HB(1,1) Real64 WL_GainPeak_LB(1,1) Real64 ZeroWL_3Term_DUAL(1,1,1) Real64 ZeroWL_3Term_HB(1,1,1) Real64 ZeroWL_3Term_LB(1,1,1) Real64 ZeroWL_5Term_DUAL(1,1,3) Real64 ZeroWL_5Term_HB(1,1,3) Real64 ZeroWL_5Term_LB(1,1,3) Real64 ZeroWL_Quad_DUAL(1,1,1)
- Page 120 Remote Control Output Parameters 4-48...
-
Page 121: Maintenance
Troubleshooting Common Problems 5-3 Verification Tests 5-9 Reinstalling the System Software 5-16 HP Support and Maintenance 5-18 Cleaning Connections for Accurate Measurements 5-20 Electrostatic Discharge Information 5-31 Returning the Instrument for Service 5-33 Hewlett-Packard Sales and Service Offices 5-36 Maintenance... - Page 122 This chapter shows you how to troubleshoot the system to the instrument level. To prevent voiding product warranty, do not remove any instrument covers. The HP 83427A chromatic dispersion test set is not customer service- able. Do not open the HP 83427A’s covers for any reason.
-
Page 123: Troubleshooting Common Problems
If laser protection error occurs on TLS Send the TLS back to HP for repair to ensure good long term performance of the system. The TLS has degraded. To continue making measurements until repairs can be made, try lowering the target power by –2 dBm and see if the problem goes... - Page 124 Maintenance Troubleshooting Common Problems If the RF signal power is low Perform a modulator bias adjustment. If the data looks incorrect If the test path contains an optical amplifier, check for possible overdriving of the receiver input of the CD test set. The input level should be less than –3 dBm.
- Page 125 Maintenance Troubleshooting Common Problems data. Because the 5-term Sellmeier curve fit has more freedom to follow the shape of the data, it may display multiple zero dispersion wavelengths under some conditions. The three types of curve fit are appropriate in different situations, as shown in the following table.
- Page 126 Often, this will help pinpoint current problems even if the system was operat- ing correctly after the repair or change to the system. 2 Setup or reinstall the HP 86037B software to determine whether the problem is a hardware or a software problem.
- Page 127 To check the computer For problems with the personal computer that are unrelated to the rest of the HP 86037B, refer to the computer manual that was shipped with this system, or call your local IT department. Troubleshoot the computer’s connection to the HP 86037B: a Make sure that the BNC cable (or a serial cable on the dual band system) is connected to the test set properly.
- Page 128 NT help system also contains a Networking Troubleshooter section which will guide you through the most common networking problems. Refer to your local IT department, or call the HP Test and Measurement Cus- tomer Support line at (800) 452-4844.
-
Page 129: Verification Tests
If the self test fails, three short beeps sounds with the message Self test..failed. The instrument will continue to operate to the extent of its capabilities. Figure 5-1. The HP 8168E/F Tunable Laser Source Table 5-4. Self Tests Test Name Test Description µ... - Page 130 Tests the motor used to control the attenuation. To run the the network analyzer self test 1 On the HP 8753 network analyzer, disconnect all devices and peripherals (including all test set interconnects). 2 Turn the network analyzer, and press the Preset key.
- Page 131 CH1, S11, log MAG, 10dB, REF 0dB, START 30kHz, STOP 3GHz (or 6GHz for Option 006). If the self test fails, refer to the HP 8753E Network Analyzer service manual for instructions on testing the individual components of the network analyzer, or call your HP service center.
- Page 132 Confirm the attenuator, splitter, and cables meet their published specifica- tions. Visually inspect the connectors. Refer to the HP 8753E network analyzer service manual for instructions on testing the individual components of the network analyzer, or call your HP ser- vice center. 5-12...
- Page 133 Maintenance Verification Tests HEWLETT PACKARD SYSTEMS RF Out 20 dB Type N Attenuator Power Splitter * Direct Connection Figure 5-5. Operator’s Check Setup To run the the network analyzer GPIB systems check The following steps test the network analyzer’s GPIB functions with a known working passive peripheral such as a plotter, printer, or disk drive.
- Page 134 If the printer or plotter does not print correctly, suspect the GPIB function of the analyzer. Refer to the troubleshooting sec- tion of the HP 8753E service manual. 5 Select the external disk drive. Press the Save/Recall button, then the Select Disk and External Disk softkeys.
- Page 135 If the resultant trace starts at 1 MHz, GPIB is functional in the analyzer. b If the resultant trace does not start at 1 MHz, suspect the GPIB function of the analyzer. Refer to the troubleshooting section of the HP 8753E service manual.
-
Page 136: Reinstalling The System Software
This section shows you how to reinstall the chromatic dispersion, National Instruments 488, and remote shell software. The DAC02 and National Instru- ments 488 software must be installed in order to run the HP 86037B. The remote shell software must be installed in order to run the HP 86037B in remote mode. - Page 137 3 When the process is complete, reboot the computer. To install the chromatic dispersion test system software • For a single band, 1300 nm HP 86037B, run the file CD_Low_Band.exe from the CD-ROM disk. • For a high band, 1550 nm HP 86037B, run the file CD_High_Band.exe from the CD-ROM disk.
-
Page 138: Hp Support And Maintenance
HP offers four distinct levels of support for system repair: • Priority Plus – Repair service 24 hours a day, seven days a week. Customers within 100 miles of an HP support facility receive an on-site visit within four hours •... - Page 139 • Complete data reports for all measured product performance • Calibration certificate and sticker showing date of nextscheduled calibration • Calibration at no charge after a repair performed by HP on products covered under a calibration agreement or under HP Support Options...
-
Page 140: Cleaning Connections For Accurate Measurements
Maintenance Cleaning Connections for Accurate Measurements Cleaning Connections for Accurate Measurements Today, advances in measurement capabilities make connectors and connec- tion techniques more important than ever. Damage to the connectors on cali- bration and verification devices, test ports, cables, and other devices can degrade measurement accuracy and damage instruments. - Page 141 HP instruments typically use a connector such as the Diamond HMS-10, which has concentric tolerances within a few tenths of a micron. HP then uses a spe- cial universal adapter, which allows other cable types to mate with this preci- sion connector.
- Page 142 0.2 µm. This process, plus the keyed axis, allows very precise core-to-core alignments. This connector is found on most HP lightwave instruments. 5-22...
- Page 143 Maintenance Cleaning Connections for Accurate Measurements The soft core, while allowing precise centering, is also the chief liability of the connector. The soft material is easily damaged. Care must be taken to mini- mize excessive scratching and wear. While minor wear is not a problem if the glass face is not affected, scratches or grit can cause the glass fiber to move out of alignment.
- Page 144 Maintenance Cleaning Connections for Accurate Measurements Figure 5-9. Clean, problem-free fiber end and ferrule. Figure 5-10. Dirty fiber end and ferrule from poor cleaning. Figure 5-11. Damage from improper cleaning. While these often work well on first insertion, they are great dirt magnets. The oil or gel grabs and holds grit that is then ground into the end of the fiber.
- Page 145 Maintenance Cleaning Connections for Accurate Measurements nectors, using small glass spheres. When used with contacting connectors, these glass balls can scratch and pit the fiber. If an index matching gel or oil must be used, apply it to a freshly cleaned connector, make the measurement, and then immediately clean it off.
- Page 146 Use an appropriate lightwave source and a compatible lightwave receiver to test insertion loss. Examples of test equipment configurations include the fol- lowing equipment: • HP 71450A or HP 71451A Optical Spectrum Analyzers with Option 002 built-in white light source. • HP 8702 or HP 8703 Lightwave Component Analyzer system.
- Page 147 The procedures in this section provide the proper steps for cleaning fiber- optic cables and HP universal adapters. The initial cleaning, using the alcohol as a solvent, gently removes any grit and oil. If a caked-on layer of material is...
- Page 148 Maintenance Cleaning Connections for Accurate Measurements Table 5-8. Dust Caps Provided with Lightwave Instruments Item HP Part Number Laser shutter cap 08145-64521 FC/PC dust cap 08154-44102 Biconic dust cap 08154-44105 DIN dust cap 5040-9364 HMS10/HP dust cap 5040-9361 ST dust cap...
- Page 149 To clean an adapter The fiber-optic input and output connectors on many HP instruments employ a universal adapter such as those shown in the following picture. These adapt- ers allow you to connect the instrument to different types of fiber-optic cables.
- Page 150 Caring for Electrical Connections The following list includes the basic principles of microwave connector care. For more information on microwave connectors and connector care, consult the Hewlett-Packard Microwave Connector Care Manual, HP part number 08510-90064. Handling and Storage • Keep connectors clean •...
-
Page 151: Electrostatic Discharge Information
Maintenance Electrostatic Discharge Information Electrostatic Discharge Information Electrostatic discharge (ESD) can damage or destroy electronic components. All work on electronic assemblies should be performed at a static-safe work station. The following figure shows an example of a static-safe work station using two types of ESD protection: •... - Page 152 • Personnel should be grounded with a resistor-isolated wrist strap before re- moving any assembly from the unit. • Be sure all instruments are properly earth-grounded to prevent a buildup of static charge. Table 13. Static-Safe Accessories HP Part Number Description × × 9300-0797 Set includes: 3M static control mat 0.6 m...
-
Page 153: Returning The Instrument For Service
HP Instrument Support Center ......(800) 403-0801 If the instrument is still under warranty or is covered by an HP maintenance contract, it will be repaired under the terms of the warranty or contract (the warranty is at the front of this manual). - Page 154 Maintenance Returning the Instrument for Service Preparing the instrument for shipping 1 Write a complete description of the failure and attach it to the instrument. Include any specific performance details related to the problem. The following information should be returned with the instrument. •...
- Page 155 Maintenance Returning the Instrument for Service modate the weight of the instrument. • Surround the equipment with approximately 7 cm (3 inches) of packing ma- terial, to protect the instrument and prevent it from moving in the carton. If packing foam is not available, the best alternative is S.D-240 Air Cap™ from Sealed Air Corporation (Commerce, California 90001).
-
Page 156: Hewlett-Packard Sales And Service Offices
Maintenance Hewlett-Packard Sales and Service Offices Hewlett-Packard Sales and Service Offices Before returning an instrument for service, call the HP Instrument Support Center at (800) 403-0801. Hewlett-Packard Sales and Service Offices (1 of 2) U.S. FIELD OPERATIONS Headquarters California, Northern... - Page 157 Maintenance Hewlett-Packard Sales and Service Offices Hewlett-Packard Sales and Service Offices (2 of 2) INTERCON FIELD OPERATIONS Headquarters Australia Canada Hewlett-Packard Company Hewlett-Packard Australia Ltd. Hewlett-Packard Ltd. 3495 Deer Creek Rd. 31-41 Joseph Street 17500 South Service Road Palo Alto, California 94304-1316 Blackburn, Victoria 3130 Trans-Canada Highway (415) 857-5027...
- Page 158 Maintenance Hewlett-Packard Sales and Service Offices 5-38...
- Page 159 Step 1. Prepare the site 6-4 Step 2. Set line voltage selector switch 6-6 Step 3. Confirm the front and rear-panel connections 6-8 Step 4. Install the system 6-10 Step 5. Load correction constants 6-11 Installation...
-
Page 160: Installation
C A U T I O N HP 86037B and HP 83427A: This system and test set are designed for use in INSTALLATION CATEGORY II and POLLUTION DEGREE 2, per IEC 1010 and... - Page 161 Installation C A U T I O N HP 83427A: Ventilation Requirements. When installing the product in a cabinet, the convection into and out of the product must not be restricted. The ambient temperature (outside the cabinet) must be less than the maximum operating temperature of the product by 4×C for every 100 watts dissipated in...
- Page 162 Installation Installation Step 1. Prepare the site Your site should accommodate the dimensions, weights, and power consump- tion limits shown in the following figure. W A R N I N G This system weighs approximately 600 lbs (270 kg). To avoid injuries, use proper moving equipment and use extreme care when installing.
- Page 163 C A U T I O N HP 86037B and HP 83427A: Install the system and test set according to the enclosure protection provided. This system and test set do not protect against the ingress of water. The system and test set protects against finger access to hazardous parts within the enclosure.
- Page 164 1 Make sure that the system is unplugged from the main power supply. 2 Confirm that the line voltage selector switch on the HP 83427A test set is set to the voltage of the mains supply. The line voltage selector switch is located next to the rear-panel line cord plug.
- Page 165 Installation Installation Fan Pack Power Distribution Assembly #1 Power Distribution Assembly #2...
- Page 166 This diagram shows cabling on an Option 012 dual-band system with Options 113 and 116. For option 114, the wavemeter is removed. • The four HP 83427A connectors S, R, A, and B should be connected to the iden- tically labeled connectors on the HP 8753E RF network analyzer. The WAVE- LENGTH METER output is connected to the HP 86120 wavelength meter, and the TUNABLE LASER SOURCE input is connected to the tunable laser.
- Page 167 Installation Installation Network Analyzer Chromatic Dispersion Test Set HP 86120B Wavelength meter Tunable Laser Source #1 Tunable Laser Source #2 HP Personal Computer...
- Page 168 9 Plug in the Power Distribution Units (PDU). 10 Turn on the system, and allow it to warm up for two hours. 11 Click on the HP 86037B chromatic dispersion test system icon located on the Windows desktop. A splash screen will appear displaying the software title followed by the application screen shown in the following figure.
- Page 169 Installation Installation Step 5. Load correction constants 1 Create correction constants for the tunable laser source. Refer to “Normalizing the Laser” on page 3-8. 2 Create correction constants for the power monitor. Refer to “Adjusting the Power Monitor” on page 3-10.
- Page 170 Installation Installation 6-12...
-
Page 171: Reference
Theory of Operation 7-2 Rack Diagram 7-6 Chromatic Dispersion–theory and management 7-8 Measurement Repeatability 7-11 Material Lists 7-13 Power Cords 7-18 System Options 7-19 Reference... -
Page 172: Theory Of Operation
Figure 7-2 through Figure 7-4 show three block diagrams of the most common system options. There are several other options which are discussed later in this chapter. The RF source of an HP 8753 RF network analyzer drives an opti-... - Page 173 Figure 7-2. HP 86037B Block Diagram (standard and Options 111, 112, 113, 114) The HP 8753 RF network analyzer measures the shift in phase of the RF signal by comparing it to a reference derived from the signal driving the modulator.
- Page 174 Reference Theory of Operation Figure 7-3. HP 86037B Block Diagram (Options 121 and 122)
- Page 175 Reference Theory of Operation Figure 7-4. The HP 86037B Option 114 block diagram...
-
Page 176: Rack Diagram
Reference Rack Diagram Rack Diagram This figure shows the dual-band system (Option 112). A single-band system such as the standard system, Option 113, Option 114, or Option 116, will not contain item , the second tunable laser source. HEWLETT PACKARD SYSTEMS H P 8168A Tunable La se r Source H P 8168A Tunable La se r Source Front... - Page 177 HP 83427A CD Test Set 150 VA MAX (220v) HP 86120x Wavelength meter 110 (115v) 150 (220v) HP 8168x or 8167x TLS #1 HP 8168x or 8167x TLS #1 Personal Computer 110 (115v) 150 (220v) PDU AW3 (110V) or PDU AW5 (220V) #1...
-
Page 178: Chromatic Dispersion-Theory And Management
Reference Chromatic Dispersion–theory and management Chromatic Dispersion–theory and management Chromatic dispersion results from a variation in propagation delay with wave- length that is shaped, in turn, by the interplay of fiber materials and dimen- sions. The result is that different frequencies of light travel down optical fiber at different speeds. - Page 179 Reference Chromatic Dispersion–theory and management fiber-optic cable is not constant over time, making compensation difficult. This effect will ultimately limit the highest achievable data rates for a single-wave- length fiber optic system. Managing chromatic dispersion Control of the total chromatic dispersion of transmission paths is critical to the design and construction of long-haul, high-speed telecommunications sys- tems.
- Page 180 Reference Chromatic Dispersion–theory and management sion compensators and wavelength division multiplexing components. In the field, chromatic dispersion is measured in connection with the installation of new systems or the upgrade of existing routes to higher bit rates. Some types of measurement systems require local access to both ends of the test fiber, making them more appropriate for factory and laboratory testing and special cases in which it is practical to measure installed fiber in a loop-back arrange- ment.
-
Page 181: Measurement Repeatability
The particular HP tunable laser source used in the measurement was so accurate that it did not introduce much wavelength error. These results are based on one system, therefore we cannot guarantee them as specifications for all systems since the absolute wavelength accuracy of HP’s tunable laser sources is specified to be... - Page 182 Reference Measurement Repeatability Table 7-3. Repeatability Data for 20 Runs Without the Multi-Wavelength Meter λ λ λ λ × × × × km)] (nm) [ps/ (nm Parameter Mean 1550.8850 0.0733461 Maximum 1550.8906 0.0734181 Minimum 1550.8789 0.0732212 Max-min 0.0117 0.0001969 Standard Deviation 0.00354 0.0000553 Table 7-4.
-
Page 183: Material Lists
Reference Material Lists Material Lists Table 7-5. Standard System Material List (1 of 3) Description Part Number Quantity SMM5.0 10 CWPNTX 0515-0386 SM 1032 CWPNPH 0570-1366 FC/PC CONNECTOR 08154-61702 BOARD-DAC CONN 0960-0988 ADPT-FBR OPT. SM 1005-0089 CBL FBR SPC 1.75M 1005-0172 CBL FBR SPC .40 1005-0173... - Page 184 Reference Material Lists Table 7-5. Standard System Material List (2 of 3) Description Part Number Quantity RCK MNT KIT 5062-3977 RK MOUNT KIT 5062-3979 RACK FLANGE KIT 5062-6450 CA 03C 03F-03M 8120-1405 CA BNC/BNC 48C 8120-2582 CA 24C 24F-24F 8120-3444 CA 24C 24F-24F 8120-3445 CBL M-N M-N7.5IN...
- Page 185 Table 7-5. Standard System Material List (3 of 3) Description Part Number Quantity MOUSEPAD 11.5×9 9300-1498 FAN ASSY 110 V C2786-60024 HP ULTRA VGA1024 OPT ABA D2825A CD ROM DRIVE D4383B 32MB SDRAM DIMM D5362A VECTRA VL D5721N LAN CARD...
- Page 186 Reference Material Lists Table 7-6. Option 112 Material List (1 of 2) Description Part Number Quantity RACK FLANGE KIT 5062-6450 CA 03C 03F-03M 8120-1405 CA BNC/BNC 48C 8120-2582 CA 24C 24F-24F 8120-3444 CA 24C 24F-24F 8120-3445 CBL M-N M-N7.5IN 8120-4782 PWR CRD 0 8120-5178 TNBL LSR SRCE...
- Page 187 Reference Material Lists Table 7-6. Option 112 Material List (2 of 2) Description Part Number Quantity HP ULTRA VGA1024 OPT ABA D2825A CD ROM DRIVE D4383B 32MB SDRAM DIMM D5362A VECTRA VL D5721N LAN CARD D6692A 1100 MM EIA 19IN AW3 (FOR 110 V)
-
Page 188: Power Cords
Straight MITI 90/230 Dark Gray Japan 8120-4754 90° 90/230 * Part number shown for plug is the industry identifier for the plug only. Number shown for cable is the HP part number for the complete cable including the plug. 7-18... -
Page 189: System Options
Add HP 8168F #007 #021 TLS 1550 nm Configuration Add HP 86120C mult-wavelength meter Add HP 83427A test set Option 112 Add HP 8168F #503 #007 #021 TLS 1600nm Configuration Add HP 86120C mult-wavelength meter Add HP 83427A test set Option 113... - Page 190 Reference System Options 7-20...
- Page 191 Specifications 8-3 Regulatory Information 8-7 Specifications and Regulatory Information...
- Page 192 Characteristics are printed in italics. Calibration cycle HP warrants instrument specifications over the recommended calibration interval. To maintain specifications, periodic recalibrations are necessary. We recommend that the HP 86037B be calibrated at an HP service facility every 24 months.
- Page 193 Table 8-1. Chromatic Dispersion Measurement Specifications Measurement Specification Wavelength Resolution 1 pm with HP 8168F/HP 8167B tunable laser source 0.1 nm with HP 8168D tunable laser source Wavelength Accuracy 0.003 nm with multi-wavelength meter 0.1 nm without multi-wavelength meter (except Option 114) 0.2 nm (Option 114)
- Page 194 Repeatability of dispersion slope at zero dispersion 0.002 ps/(nm2 × km) (characteristic) wavelength Zero dispersion wavelength accuracy ±0.05 nm with wavelength meter (With HP 8168F) ±0.15 nm without wavelength meter (With HP 8168F) ±0.25 nm without wavelength meter (With HP 8168D) ±0.25 dB (characteristic)
- Page 195 Specifications and Regulatory Information Specifications Length Measurement Specifications Measurement Specification Range 0.2 m to 100,000 km (amplified system) 0.05 mm or 0.1% of the measured length, whichever is Range resolution greater. (characteristic) Group refractive index 1.0000 – 2.0000 (user adjustable) a.
-
Page 196: Specifications And Regulatory Information Specifications
Specifications and Regulatory Information Specifications General System Characteristics Specification indoor Altitude Up to 15,000 feet (4,572 meters) ° ° Non-operating temperature –40 C to 70 Power Requirements 110, 120, 220, or 240 VAC ±10% 47 Hz to 66 Hz Single band system: 595 WATTS MAX Dual band system: 726 WATTS MAX Weight Single band system: 249 kg (548 lbs) -
Page 197: Regulatory Information
Specifications and Regulatory Information Regulatory Information Regulatory Information This is to declare that this system is in conformance with the German Regula- tion on Noise Declaration for Machines (Laermangabe nach der Maschinen- laermrerordnung -3.GSGV Deutschland). Notice for Germany: Noise Declaration Acoustic Noise Emission Geraeuschemission LpA <... - Page 198 Specifications and Regulatory Information Regulatory Information Declaration of Conformity...
- Page 199 2-31 Combined command, 2-18 Absolute Group Delay Measurement area, 2-14 Compact Database command, 2-35 Addresses command, 2-19 components HP 83427A, archiving data, 2-34 compressed dust remover, 5-27 ASCII files, 2-29 connections Average Factor, 2-16, 2-17, 3-14 care manual,...
- Page 200 2-30 gain peak and FWHM, 2-30 HP 86037A group delay, 2-30 options, 7-19 quadratic fit coefficients, 2-30 HP Defaults, 2-15, 2-17 statistics for groups, 2-31 HP offices, 5-36 test date and time, 2-31 HP Support, 5-18 test information and conditions,...
- Page 201 Index specifications, normalization area, Length Measurement command, 2-17 Normalization command, 2-18, 3-13 Length not required, 2-12 Notepad button, line-power nulti-wavelength meter cables, 7-18 adding, 2-20 specifications, number of measurements, 2-18 list pane, Number of Tries, 2-14 main window, Open Database command, 2-33 material dispersion, Open Setup command,...
- Page 202 Index chromatic dispersion measurement, length measurement, quadratic curve fit, 2-28, 2-30 operating, spreadsheet file, 2-29 standard system block diagram, Start, rack power requirements, start test, Range menu, 2-18 Start Test button, recall, 2-32 statistics for groups, 2-31 receiver input, 1-6, 2-36, 3-6, 3-7, 3-8, 3-10 Stop, Ref,...
- Page 203 Index waveguide dispersion, wavelength, #steps, Delta, division multiplexing, 7-9, 7-10 meter, 2-20 preferred, 2-32 range, reference, settings, start, stop, Wavelength Meter command, 2-20 Wavelength Selection area, WDM. See wavelength division multiplexing y-axis data, 2-23 zero dispersion wavelength, Index-5...
- Page 204 Index Index-6...